Japanese version here
Updated January 2020
Updated January 2020
Superposition on Google Maps
The On-Demand version allows you to superimpose the following data on Google Maps as reference material for locating the plot line (the "items in quotation marks" are options in the on-screen display menu of the On-Demand version).Seamless geological information
- "Earthquake epicenters (all-Japan hypocenter catalog by the JMA)"
- See corresponding parts in "Postscript File Plots."
- "Upper limit of the seismogenic layer (D90)"
- See corresponding parts in "Postscript File Plots."
- "Gravity anomaly (Bouguer anomaly)"
- See corresponding parts in "Postscript File Plots."
- "Seamless digital geological map of Japan (1:200,000)®"
- Data from the Seamless digital geological map of Japan (1:200,000)® in the GSJ database collection, AIST.
- "Japan engineering geomorphlogical classification map"
- Wakamatsu, K., Kubo, S., Matsuoka, M., Hasegawa, K., and Sugiura, M.: Japan enginieering geomorphologic classification map, Univ. of Tokyo Press, 2005 (product serial number: JEGM0936).
- "Average shear-wave velocity in the top 30 m"
- Matsuoka, M., K. Wakamatsu, K. Fujimoto and S. Midorikawa , Average shear-wave velocity mapping using Japan engineering geomorphologic classification map, Journal of Structural Engineering and Earthquake Engineering, Japan Society of Civil Engineers, Vol.23, No.1, pp.57s-68s, 2006.4. [doi:10.2208/jsceseee.23.57s]
The other geological information (KML)
- "Active Fault Database"
- Active fault segment lines from the active fault database of Japan (Ver. 2013) in the GSJ database collection, AIST, slightly simplified for use on the Web.
- "Active Volcanoes Database"
- Data from Quaternary Volcanoes in Japan in the GSJ database collection, AIST.
- "Offshore Geologic Structures Database"
- Part of data from the Offshore geologic structures database (06-Oct-2010) in the GSJ database collection, AIST.
- "Pacific plate iso-depth contours (Zhao et al., 1993)"
- See corresponding parts in "Postscript File Plots."
- "Pacific plate iso-depth contours (Fujiwara et al., 2009; J-SHIS, NIED)"
- See corresponding parts in "Postscript File Plots."
- "Pacific plate iso-depth contours (KNHN compiled by Hirose)"
- See corresponding parts in "Postscript File Plots."
- "Philippine Sea plate iso-depth contours (Nakamura and Kaneshiro, 2000; Nansei Islands)
- See corresponding parts in "Postscript File Plots."
- "Philippine Sea plate iso-depth contours (Fujiwara et al., 2009; J-SHIS, NIED)
- See corresponding parts in "Postscript File Plots."
- "Philippine Sea plate iso-depth contours (BNHHHN compiled by Hiros)
- See corresponding parts in "Postscript File Plots."
- "Geologic strain concentration zones in northeast Japan"
- Okamura, Y., 2002, Neogene and later strain concentration zones, in Active Faults and Seismo-Tectonics of the Eastern Margin of the Japan Sea, edited by M. Ohtake, A. Taira and Y. Ota, pp. 111-121, University of Tokyo Press, Tokyo (in Japanese).
- "Rectangular faults (JSHIS, NIED)"
- Numerical data downloaded from (the Japan Seismic Hazard Information Station (J-SHIS) of the National Research Institute for Earth Science and Disaster Prevention (NIED) (downloaded on 1-June-2014) are used. The user should obey the terms and conditions of J-SHIS when publishing plot results.
- "Rectangular faults (Japan Earthquake Fault Parameters Handbook by Sato 1989)"
- See Rectangular Models of Earthquake Faults in "PS File Plots."
- "Rectangular faults (Japan Heterogeneous Fault Parameters Catalog by ADEP 2005)"
- See Rectangular Models of Earthquake Faults in "PS File Plots."
- "Crustal Stress Fields Database (stress measurements, SHmax) / (anisotropy, LSPD)"
- Data from the Crustal Stress Fields Database (January, 2014) in the GSJ database collection, AIST.
- "Historical Earthquakes (679-2008, M6.5 or greater)"
- Data from EQLIST (Ver. 4.4), an earthquake search system. EQLIST is a hypocenter plot software developed by Mr Chirashi-Zushi. It helps to conduct search, make lists and create plots out of around 30,000 earthquakes, including historical earthquakes and recent (1885 and later) magnitude > 4 earthquakes that occurred in and around Japan. We use data on 874 earthquakes, resulting from a search in the range 24-50N, 122-152E, M6.5-, and depth 0-600 km.
Postscript (PS) File Plots
The On-Demand version allows you to plot, in the postscript (PS) file format, images of geological information / subsurface structures along any line of your choice. Below is detailed information on the sources of the plot data (the "items in quotation marks" are options in the on-screen display menu of the On-Demand version).Tomography data (velocity structures)
- [Warnings]
-
- On the grid for tomography analysis.
- Our system plots, in + (plus) symbols, the grid defined for tomography analysis. We have taken care to describe the grid configuration as faithfully as possible to the explainations in the original articles, but in some cases, we have only given simple descriptions for spatially inhomogeneous configurations. Please make sure to refer to the original articles when detailed examinations are necessary.
- On reference velocity structures for dVp and dVs.
- When no dVp or dVs values are contained in the original data, our system calculates them by the formulae dVp = (Vp-Vp0)/Vp0 and dVs = (Vs-Vs0)/Vs0, where Vp0 and Vs0 are the reference P and S wave velocities, respectively (functions of depth), which do not necessarily agree with the initial velocities or average velocities given in the cited literature. In other words, we calculated them, in some cases, from the Vp and Vs information in the data files for convenience in order to have them plotted in our system.
- On the confidence indicator (conflim).
- Our system plots the areas of high confidence, which are selected on the basis of quantities, relevant to the model confidence, extracted from the information contained in the distributed data. The confidence indicators differ for different sets of data, but for convenience, our system represents them by a single parameter named conflim, a positive number so defined that it approaches zero with increasing confidence. As described below, the threshold values of conflim for data plotting are defined appropriately dataset by dataset (these values are set for convenience, so please make sure to refer to the original articles and scrutinize the uncertainties and resolutions when detailed examinations are necessary).
- "All Japan by Matsubara et al. (2011)" (Vp, Vs, P (Poisson's ratio), dVp and dVs plottable
- Geographical extent
- All Japan including Hokkaido and Okinawa
- Grid spacings
- In the latitudinal and longitudinal directions, 0.1º intervals. In the depth direction, 2.5 km (down to 10 km in depth), 5 km (< 40 km), 10 km (< 60 km), 15 km (< 180 km), 20 km (< 300 km) and 25 km (more than 300 km) intervals.
- Reference velocity structures for dVp and dVs
- The spatial averages of Vp and Vs at each depth were taken as the reference velocities (only Vp and Vs data that satisfied conflim ≤ 0.8 were used to calculate the averages).
- Confidence indicator
- The values contained in the distributed data file, titled "reliability (value derived from the difference between the assumed perturbations and the obtained perturbations in the 12 surrounding grid elements in the checkerboard test. The confidence is high if this value is smaller than 0.8)," were used as the conflim. The default value is 0.8.
- Citation
- Matsubara, M. and K. Obara, 2011, The 2011 Off the Pacific coast of Tohoku earthquake related to a strong velocity gradient with the Pacific plate, Earth Planets Space, 63, 663-667, doi:10.5047/eps.2011.05.018.
- Note
- Digital data and dedicated plotting software are downloadable from the National Research Institute for Earth Science and Disaster Prevention Website. The page contains descriptions of the data and the resolution.
- "All Japan by Matsubara et al. (2008)" (Vp, Vs, P (Poisson's ratio), dVp and dVs plottable
- Geographical extent
- All Japan
- Grid spacings
- In the latitudinal and longitudinal directions, 0.1º intervals. In the depth direction, 2.5 km (down to 10 km in depth), 5 km (< 40 km), 10 km (< 60 km), 15 km (< 180 km), 20 km (< 300 km) and 25 km (more than 300 km) intervals.
- Reference velocity structures for dVp and dVs
- The spatial averages of Vp and Vs at each depth were taken as the reference velocities (only Vp and Vs data that satisfied conflim ≤ 0.8 were used to calculate the averages).
- Confidence indicator
- The values contained in the distributed data file, titled "reliability (value derived from the difference between the assumed perturbations and the obtained perturbations in the 12 surrounding grid elements in the checkerboard test. The confidence is high if this value is smaller than 0.8)," were used as the conflim. The default value is 0.8.
- Citation
- Matsubara, M., K. Obara, and K. Kasahara, 2008, Three-dimensional P- and S-velocity structures beneath the Japan Islands obtained by high-density seismic stations by seismic tomography, Tectonophysics, 454, 86-103, doi:10.1016/j.tecto.2008.04.016
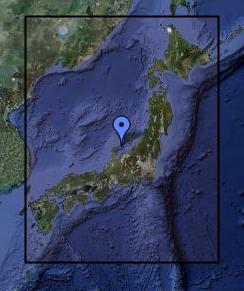
- # "All-Japan by Nakamura et al. (2008)" (Vp, Vs, P, dVp and dVs plottable)
- Geographical extent
- All Japan
- Grid spacings
- In the latitudinal and longitudinal directions, 0.1º intervals beneath land and 0.2º intervals beneath the sea (note that, for convenience, our system plots plus symbols at 0.1º intervals in all areas). In the depth direction, grid points are allocated at 2 km, 5 km, 10 km, 20 km, 30 km and 40 km in depth. The intervals are 20 km below 40 km in depth.
- Reference velocity structures for dVp and dVs
- Velocity structures standard.p and standard.s, included in the distributed data, were used as the reference.
- Confidence indicator
- None
- Citation
- Nakamura M., Y. Yoshida, D. Zhao, H. Takayama, K. Obana, H. Katao, J. Kasahara, T. Kanazawa, S. Kodaira, T. Sato, H. Shiobara, M. Shinohara, H. Shimamura, N. Takahashi, A. Nakanishi, R. Hino, Y. Murai, and K. Mochizuki, 2008, Three-dimensional P- and S-wave velocity structures beneath Japan, Phys. Earth Planet. Inter., 168, 49-70.
- Note
- Digital data are downloadable from the Earthquake Research Institute Website.
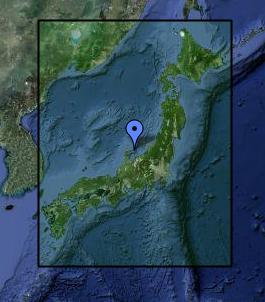
- # "All-Japan by Abdelwahed and Zhao (2007)" (Vp and dVp plottable)
- Geographical extent
- All Japan
- Grid spacings
- In the latitudinal and longitudinal directions, 0.4º intervals. In the depth direction, 20 km (< 100 km), 40 km (100-300 km) and 60 km (300-700 km) intervals.
- Reference velocity structures for dVp and dVs:
- The distributed data contained dVp (dVs) values, so there was no need to designate "reference velocity structures" in our system (we used the dVp and dVs values just as they were in the distributed data).
- Confidence indicatore
- None
- Citation
- Abdelwahed, M. F. and D. Zhao, 2007, Deep structure of the Japan subduction zone, Phys. Earth Planet. Inter. 162, 32-52.
- Note
- Digital data are downloadable from the Earthquake Research Institute Website.
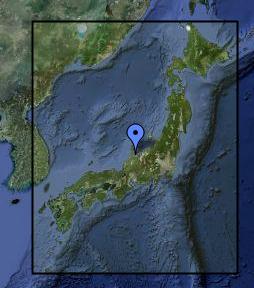
- # "All-Japan by Nishida et al. (2008)" (Vs and dVs plottable)
- Geographical extent
- All Japan
- Grid spacings
- In the latitudinal and longitudinal directions, 0.1º intervals. In the depth direction, 1 km intervals.
- Reference velocity structures for dVp and dVs
- Spatial averages at individual depths were used as the reference velocities.
- Confidence indicator
- None
- Citation
- Nishida, K., Kawakatsu, H., and K. Obara, 2008, Three-dimensional crustal S wave velocity structure in Japan using microseismic data recorded by Hi-net tiltmeters, J. Geophys. Res., 113, B10302, doi:10.1029/2007JB005395.
- Note
- Surface-wave tomography using pulsations of the Earth. Digital data are downloadable from the Earthquake Research Institute Website.
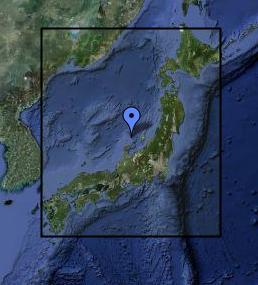
- # "All Tohoku by Nakajima et al. (2001)" (Vp, Vs, P, dVp and dVs plottable)
- Geographical extent
- Area covering the whole Tohoku District, spanning from the Oshima Peninsula to northern Kanto District (range: 36.0ºN-42.0ºN, 138.5ºE-142.25ºE)
- Grid spacings
- In the latitudinal and longitudinal directions, 0.25º intervals. In the depth direction, 10-30 km intervals (more specifically, grid points were allocated at 0, 10, 25, 40, 65, 90, 120 and 150 km in depth).
- Reference velocity structures for dVp and dVs
- "Deviations from the average velocities" as indicated in the distributed data file were used as dVp and dVs.
- Confidence indicator
- None
- Citation
- Nakajima, J., T. Matsuzawa, A. Hasegawa and D. Zhao, 2001, Three-dimensional structure of Vp, Vs, and Vp/Vs beneath northeastern Japan: Implications for arc magmatism and fluids, J. Geophys. Res., 106, 21,843-21,857.
- Note
- Digital data are downloadable from the Earthquake Research Institute Website.
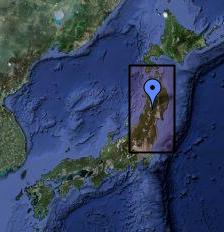
- "Chuetsu area of Niigata Prefecture by Kato et al. (2006)" (Vp, Vs, P, dVp and dVs plottable)
- Geographical extent
- Rectangular area, 60 x 60 km in size, centered on the source area of the 2004 Niigata-ken Chuetsu earthquake (37.3ºN, 138.9ºE)
- Grid spacings
- In the horizontal directions, about 3 km in the source area. More specifically, grid points were set at locations -30, -18, -12, -9, -6, -3, 0, 3, 6, 9, 12, 18 and 30 km in the N125ºE direction, and -30, -24, -18, -15,-12,-9,-6,-3, 0, 3, 6, 9, 12, 15, 18, 24 and 30 km in the N35ºE direction, with the origin at (37.3ºN, 138.9ºE). In the depth direction, grid points were allocated at 0, 3, 6, 9, 12, 15 and 20 km.
- Reference velocity structures for dVp and dVs
- Spatial averages of Vp and Vs at individual depths were used as the reference velocities (only Vp and Vs data that satisfied conflim ≤ 0.05 in each case were used to calculate the averages).
- Confidence indicator
- The inverse of dws was used as the conflim. The default value is 0.05.
- Citation
- Kato, A., S. Sakai, N. Hirata, E. Kurashimo, T. Iidaka, T. Iwasaki, and T. Kanazawa, 2006, Imaging the seismic structure and stress field in the source region of the 2004 mid-Niigata prefecture earthquake: Structural zones of weakness and seismogenic stress concentration by ductile flow, J. Geophys. Res. 111, B08308, doi:10.1029/2005JB004016.
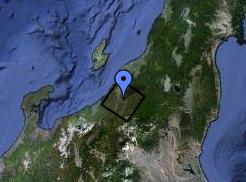
- "Chuetsu area of Niigata Prefecture by Takeda et al. (2005)" (Vp, Vs, P, dVp and dVs plottable)
- Geographical extent
- Rectangular area, 80 x 100 km in size, centered on the southern part of the 2004 Niigata-ken Chuetsu earthquake source area (37.1ºN, 138.8ºE)
- Grid spacings
- In the N30ºE direction, 8-12 km intervals. In the N120ºE direction, 10-15 km intervals. In the depth direction, 3 km intervals (down to 18 km in depth).
- Reference velocity structures for dVp and dVs
- Spatial averages of Vp and Vs at individual depths were used as the reference velocities (only Vp and Vs data that satisfied conflim ≤ 0.05 in each case were used to calculate the averages).
- Confidence indicator
- The inverse of dws was used as the conflim. The default value is 0.05.
- Citation
- Takeda, T., Y. Kuwahara, K. Imanishi, and Y. Haryu, 2005, Crustal structure in southern area of the 2004 Mid-Niigata earthquake by Double-Difference Tomography method, Abstracts, Japan Earth Planet. Sci. Joint Meeting (CD-ROM), S101-007.
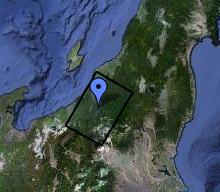
- # "Niigata-Kobe Tectonic Zone by Nakajima and Hasegawa (2007)" (Vp, Vs, P, dVp and dVs plottable)
- Geographical extent
- Area centered on the zone of strain concentration (from Niigata to Kobe) (range: 33.4ºN-38.0ºN and 134.0ºE-140.0ºE)
- Grid spacings
- In the latitudinal and longitudinal directions, 0.2º intervals. In the depth direction, 5-15 km (0-40 km in depth), 20 km (40-120 km in depth) and 30 km (more than 120 km in depth) intervals.
- Reference velocity structures for dVp and dVs
- "Deviations from the average velocities" as indicated in the distributed data file were used as dVp and dVs.
- Confidence indicator
- The inverse of the "P wave (S wave) hit count", as indicated in the distributed data file, was used as the conflim. The default value is 0.00001.
- Citation
- Nakajima, J. and A. Hasegawa, 2007, Deep crustal structure along the Niigata-Kobe Tectonic Zone, Japan: Its origin and segmentation, Earth, Planets and Space, 59, e5-e8.
- Note
- Digital data are downloadable from the Earthquake Research Institute Website.
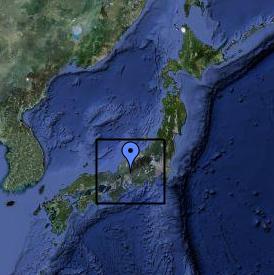
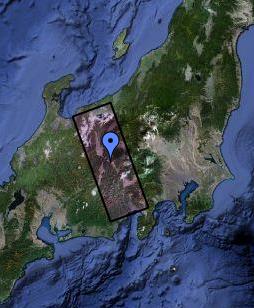
- "Itoigawa-Shizuoka Tectonic Line and its surroundings by Kasahara et al. (2006)" (Vp, Vs, P, dVp and dVs plottable)
- Geographical extent
- Rectangular area, 80 x 220 km in size, along the Itoigawa-Shizuoka Tectonic Line
- Grid spacings
- In the N20ºW and N70ºE directions, 10 km intervals each. In the depth direction, 3 km (down to 15 km in depth) and 10-15 km (15-40 km) intervals.
- Reference velocity structures for dVp and dVs
- Spatial averages of Vp and Vs at individual depths were used as the reference velocities (only Vp and Vs data that satisfied conflim ≤ 0.05 in each case were used to calculate the averages).
- Confidence indicator
- The inverse of dws was used as the conflim. The default value is 0.05.
- Citation
- Kasahara, K., Y. Asano, T. Takeda, S. Hori, K. Obara, K. Shiomi, S. Sekine, M. Matsubara, and Y. Ito, 2006, Observation of natural earthquakes in the neighborhood of the fault zone (long-term mobile observation), in Achievement Report for Fiscal 2005, Priority Survey and Observation in the Itoigawa-Shizuoka Tectonic Line Fault Zone, pp. 34-52, Research and Development Bureau of the Ministry of Education, Culture, Sports, Science and Technology, Geospatial Information Authority of Japan of the Ministry of Land, Infrastructure, Transport and Tourism, and the Earthquake Research Institute of the University of Tokyo (in Japanese).
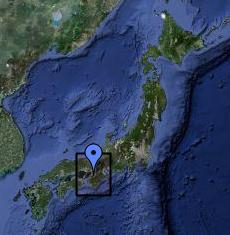
- "Kobe (Kinki District) by Zhao et al. (1996)" (Vp, Vs, P, dVp and dVs plottable)
- Geographical extent
- Neighborhood of Kobe (Kinki District) (range: 33-36ºN and 134-137ºE)
- Grid spacings
- In the north-south and east-west directions, 0.05-0.2º. In the depth direction, 3-6 km (down to 35 km in depth).
- Reference velocity structures for dVp and dVs
- The distributed data contained dVp (dVs) values, so there was no need to designate "reference velocity structures" in our system (we used the dVp and dVs values just as they were in the distributed data).
- Confidence indicator
- None
- Citation
- Zhao, D., H. Kanamori, H. Negishi, and D. Wiens, 1996, Tomography of the source area of the 1995 Kobe earthquake: Evidence for fluids at the hypocenter?, Science, 274, 1891-1894.
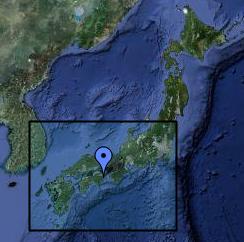
- # "Kii Peninsula and the Chugoku/Shikoku Districts by Nakajima et al. (2007EPSL)" (Vp, Vs, P, dVp and dVs plottable)
- Geographical extent
- Area covering southwestern Japan from eastern Kyushu to the Chubu District (range: 32ºN-35.5ºN and 131ºE-137ºE)
- Grid spacings
- In the latitudinal and longitudinal directions, 0.3º intervals. In the depth direction, 10-50 km intervals (more specifically, grid points were allocated at depths of 0, 10, 25, 40, 60, 80, 100, 120, 140, 160, 180, 210, 240, 270, 300, 350, 400 and 450 km).
- Reference velocity structures for dVp and dVs
- "Deviations from the average velocities" as indicated in the distributed data file were used as dVp and dVs.
- Confidence indicator
- The inverse of the "P wave (S wave) hit count", as indicated in the distributed data file, was used as the conflim. The default value is 0.00001.
- Citation
- Nakajima, J. and A. Hasegawa, 2007, Tomographic evidence for the mantle upwelling beneath southwestern Japan and its implications for arc magmatism: Earth and Planetary Science Letters, 254, 90-105.
- Note
- Digital data are downloadable from the Earthquake Research Institute Website.
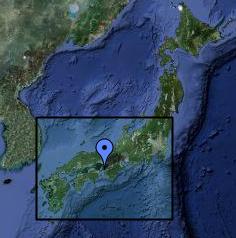
- # "Southwestern Japan by Nakajima et al. (2007JGR)" (Vp, Vs, P, dVp and dVs plottable)
- Geographical extent
- Area covering southwestern Japan from Kyushu to northern Kanto
- Grid spacings
- In the Chugoku and Shikoku Districts, 0.3º intervals in the north-south direction and 0.4º intervals in the east-west direction. In the other districts, 0.25º intervals in the north-south direction and 0.3º intervals in the east-west direction. In the depth direction, 10-15 km (down to 60 km in depth) and 20-40 km (more than 60 km in depth) intervals.
- Reference velocity structures for dVp and dVs
- "Deviations from the average velocities" as indicated in the distributed data file were used as dVp and dVs.
- Confidence indicator
- The inverse of the "P wave (S wave) hit count", as indicated in the distributed data file, was used as the conflim. The default value is 0.00001.
- Citation
- Nakajima, J. and A. Hasegawa, 2007, Subduction of the Philippine Sea plate beneath southwestern Japan: Slab geometry and its relationship to arc magmatism: J. Geophys. Res., 112, B08306, doi:10.1029/2006JB004770.
- Note
- Digital data are downloadable from the Earthquake Research Institute Website.
Hypocenters
- "All-Japan hypocenter catalog by the JMA"
- Japan Meteorological Agency, since 14-Jan-1923, Annual Earthquake Report CD-ROM.
- Note
- The whole body of the annual catalog is included by selecting "Plot all of the 20XX all-Japan hypocenter catalog by the JMA" in the basic selection menu. In the meantime, only the data with the hypocenter determination flag "K" (good accuracy) are picked up by selecting "All-Japan hypocenter catalog by the JMA" under "Use detailed settings on the hypocenter data." The standard deviation for the depth was set at 999 km if the hypocenter was determined with its depth fixed. The JMA magnitude I was selected as the magnitude value.
- "Precise determination of hypocenters along the ISTL by Obara et al. (2008)"
- Obara, K., T. Takeda, Y. Asano, Y. Yukutake, K. Shiomi, M. Matsubara, S. Sekine, and S. Hori, 2008, Observation of natural earthquakes in the neighborhood of the fault zone (long-term mobile observation), in Achievement Report for Fiscal 2007, Priority Survey and Observation in the Itoigawa-Shizuoka Tectonic Line Fault Zone, pp. 33-48, Research and Development Bureau of the Ministry of Education, Culture, Sports, Science and Technology, Geospatial Information Authority of Japan of the Ministry of Land, Infrastructure, Transport and Tourism, and the Earthquake Research Institute of the University of Tokyo (in Japanese).
- "Seismicity surrounding the 1995 Hyogo-ken Nambu earthquake by Zhao et al. (1996)"
- Zhao, D., H. Kanamori, H. Negishi, and D. Wiens, 1996, Tomography of the source area of the 1995 Kobe earthquake: Evidence for fluids at the hypocenter?, Science, 274, 1891-1894.
- "2004 Chuetsu earthquake aftershock distribution by Kato et al. (2006)"
- Kato, A., S. Sakai, N. Hirata, E. Kurashimo, T. Iidaka, T. Iwasaki, and T. Kanazawa, 2006, Imaging the seismic structure and stress field in the source region of the 2004 mid-Niigata prefecture earthquake: Structural zones of weakness and seismogenic stress concentration by ductile flow, J. Geophys. Res. 111, B08308, doi:10.1029/2005JB004016.
Tectonic line
- "Conrad and Moho depths"
- "Zhao et al. (1992)"
- Zhao, D., S. Horiuchi and A. Hasegawa, 1992, Seismic velocity structure of the crust beneath the Japan Islands, Tectonophysics, 212, 289-301.
- "Katsumata (2010)"
- Katsumata, A., 2010, Depth of the Moho discontinuity beneath the Japanese islands estimated by traveltime analysis, J. Geophys. Res., 115, B04303, doi:10.1029/2008JB005864.
- "Depths of the upper surface of the Pacific plate"
- "Zhao et al. (1993)"
- Zhao, D., and A. Hasegawa, 1993, P wave tomographic imaging of the crust and upper mantle beneath the Japan Islands, J. Geophys. Res., 98, 4333-4353.
- "Fujiwara et al. 2009; J-SHIS, NIED"
- Fujiwara, H., S. Kawai, S. Aoi, N. Morikawa, S. Senna, N. Kudo, M. Ooi, K. X.-S. Hao, K. Wakamatsu, Y. Ishikawa, T. Okumura, T. Ishii, S. Matsushima, Y. Hayakawa, N. Toyama, and A. Narita, 2009, A study on "National Seismic Hazard Maps for Japan", Technical Note of the National Research Institute for Earth Science and Disaster Prevention, No. 336 (in Japanese).
- Note
- Numerical data (P-Y2010-PRM-PLATE_SHP_PSE_CPCF.csv, downloaded on 09-Jan-2011) downloaded from (the Japan Seismic Hazard Information Station (J-SHIS) of the National Research Institute for Earth Science and Disaster Prevention (NIED) are published here under permission by the NIED. The user should obey the terms and conditions of J-SHIS when publishing plot results.
- "KNHN compiled by Hirose"
- Data compiled by Dr Fuyuki Hirose of the Meteorological Research Institute are published here under his and his co-authors' permission. (Digital data are downloadable from Dr Hirose's Website. The data in our system were downloaded from his Website on 04-Feb-2011.) When publishing plot results, the user should cite the original paper(s) corresponding to the study region [Kita et al. (2010) for Hokkaido and northern Tohoku; Nakajima and Hasegawa (2006) for northern and southern Tohoku; Nakajima et al. (2009) for Kanto and northern Izu Arc].
- Nakajima, J., and A. Hasegawa, 2006, Anomalous low-velocity zone and linear alignment of seismicity along it in the subducted Pacific slab beneath Kanto, Japan: Reactivation of subducted fracture zone?, Geophys. Res. Lett., 33, L16309, doi: 10.1029/2006GL026773.
- Nakajima, J., F. Hirose, and A. Hasegawa, 2009, Seismotectonics beneath the Tokyo metropolitan area, Japan: Effect of slab-slab contact and overlap on seismicity, J. Geophys. Res., 114, B08309, doi:10.1029/2008JB006101.
- Kita, S., T. Okada, A. Hasegawa, J. Nakajima, and T. Matsuzawa, 2010, Anomalous deepening of a seismic belt in the upper-plane of the double seismic zone in the Pacific slab beneath the Hokkaido corner: Possible evidence for thermal shielding caused by subducted forearc crust materials, Earth Planet. Sci. Lett., 290, 415-426.
- "Depths of the upper surface of the Philippine Sea plate"
- "Nakamura and Kaneshiro (2000)"
- Nakamura, M., and S. Kaneshiro, 2000, Determination of subducted Philippine Sea Plate in the Nansei islands deduced from hypocenter data, Bull. Fac. Sci., Univ. Ryukyus, 70, 73-82 (in Japanese with English abstract).
- Note
- Numerical data in Table 1 of the cited article are used.
- "Fujiwara et al. 2009; J-SHIS, NIED"
- Fujiwara, H., S. Kawai, S. Aoi, N. Morikawa, S. Senna, N. Kudo, M. Ooi, K. X.-S. Hao, K. Wakamatsu, Y. Ishikawa, T. Okumura, T. Ishii, S. Matsushima, Y. Hayakawa, N. Toyama, and A. Narita, 2009, A study on "National Seismic Hazard Maps for Japan", Technical Note of the National Research Institute for Earth Science and Disaster Prevention, No. 336 (in Japanese).
- Note
- Numerical data (P-Y2010-PRM-PLATE_SHP_PSE_CPHL.csv, downloaded on 09-Jan-2011) downloaded from the Japan Seismic Hazard Information Station (J-SHIS) of the National Research Institute for Earth Science and Disaster Prevention (http://www.j-shis.bosai.go.jp/?lang=en) are used. The user should obey the terms and conditions of J-SHIS when publishing plot results.
- "BNHHHN compiled by Hirose"
- Data compiled by Dr Fuyuki Hirose of the Meteorological Research Institute are published here under his and his co-authors' permission. (Digital data are downloadable from Dr Hirose's Website. The data in our system were downloaded from his Website on 04-Feb-2011.) In regions where iso-depth contours are interrupted midway, we represented, for convenience, the upper surface of the Philippine Sea plate by a single, smoothly curving surface (in vertical section plots in our Visualization System, iso-depth contours are represented by solid and dashed curves, respectively, in regions where they are drawn and not drawn).
- When publishing plot results, the user should cite the original paper(s) corresponding to the study region [Baba et al. (2002), Nakajima and Hasegawa (2007) and Hirose et al. (2008) for southwestern Japan; Hirose et al. (2008) for Kanto; Nakajima et al. (2009) for the northern extension of Izu].
- Baba, T., Y. Tanioka, P. R. Cummins, and K. Uhira (2002), The slip distribution of the 1946 Nankai earthquake estimated from tsunami inversion using a new plate model, Phys. Earth Planet. Inter., 132, 59-73.
- Hirose, F., J. Nakajima, and A. Hasegawa (2008), Three-dimensional seismic velocity structure and configuration of the Philippine Sea slab in southwestern Japan estimated by double-difference tomography, J. Geophys. Res., 113, B09315, doi:10.1029/2007JB005274.
- Hirose, F., J. Nakajima, and A. Hasegawa, 2008, Three-dimensional velocity structure and configuration of the Philippine Sea slab beneath Kanto district, central Japan, estimated by double-difference tomography, Zisin J. Seismol. Soc. Japan, Second Series, 60, 123-138 (in Japanese with English abstract).
- Nakajima, J., and A. Hasegawa (2007), Subduction of the Philippine Sea plate beneath southwestern Japan: Slab geometry and its relationship to arc magmatism, J. Geophys. Res., 112, B08306, doi:10.1029/2006JB004770.
- Nakajima, J., F. Hirose, and A. Hasegawa, 2009, Seismotectonics beneath the Tokyo metropolitan area, Japan: Effect of slab-slab contact and overlap on seismicity, J. Geophys. Res., 114, B08309, doi:10.1029/2008JB006101.
- "Active faults"
- National Institute of Advanced Industrial Science and Technology, 2013, Active Fault Database of Japan, July 23, 2013 Version. Research Information Database DB095, National Institute of Advanced Industrial Science and Technology. https://gbank.gsj.jp/activefault/index_e_gmap.html
Rectangular Models of Earthquake Faults
- "Japan Earthquake Fault Parameters Handbook by Sato (1989)"
- Sato, R. (editor), 1989, Japan Earthquake Fault Parameters Handbook, Kajima Institute Publishing, Tokyo (in Japanese).
- Note
- We basically used the data in Table 1-1 of the cited book. When a multitude of models exist for a single earthquake, we restricted the number of models appropriately (the dataset does not include all models). For rigorous examinations, it is essential to refer to the original publication, because the data do not include the whole list in the original literature and because the input was done manually.
- "Japan Heterogeneous Fault Parameters Catalog by ADEP (2005)"
- Earthquake Source Characteristics Section, Seismotectonics Study Group, Association for the Development of Earthquake Prediction (editor), Sato, R. (chief investigator), Koketsu, K. (investigator), 2005, Japan Heterogeneous Fault Parameters Catalog [Part Two] (1944-2003), Association for the Development of Earthquake Prediction, Tokyo (in Japanese).
- Note
- The parameters were mostly extracted from the "Table of heterogeneous fault parameters" in the cited literature, but parameter values were read from figures in the corresponding explanatory sections wherever necessary. When a multitude of models exist for a single earthquake, we restricted the number of models appropriately (the dataset does not include all models). For rigorous examinations, it is essential to refer to the original publication, because the data do not include the whole list in the original literature, because the input was done manually, and also because some of the values were read visually from figures and tables.
Others
- "Geological Map of Japan"
- Geological Survey of Japan, AIST, 2003, Geological Map of Japan 1:1,000,000, 3rd Edition, 2nd CD-ROM Version.
- "Topography"
- Land areas
- Digital maps 250 m grid (elevation), issued by the Geospatial Information Authority of Japan (GSI), are used under approval by the GSI Director General (approval number: Hei 22 Gyo-Shi 543). Smoothing is applied to topography plots on all-Japan scales.
- Sea areas
- "J-EGG500 (JODC Expert Grid Data for Geography 500 m)," or bathymetry data 500 m grid for areas surrounding Japan, issued by the Japan Oceanographic Data Center, are used. However, "Global Topography Version 13.1" (Smith et al., 1997), topography data at 1 minute resolution released by the Scripps Institution of Oceanography of the University of California, is used in rectangular areas with diagonals (38°N, 128°E)-(41°N, 129°E), (38°N, 129°E)-(44°N, 135°E) and (30°N, 144°E)-(34°N, 147°E). Smith, W. H. F., and D. T. Sandwell, 1997, Global sea floor topography from satellite altimetry and ship depth soundings, Science, 277, 1956-1962.
- Land-sea margins
- Kisimoto, K., 2000, Combined bathymetric and topographic mesh data: Japan250m.grd, GSJ Open-file Report, No. 353 (in Japanese)
- "Gravity anomaly"
- Geological Survey of Japan, AIST, 2004, Gravity CD-ROM of Japan, Ver. 2.
- Note
- Our system plots Bouguer anomalies for an assumed density of 2.67 g/cm3.
- "Quaternary volcanoes"
- Data from Quaternary Volcanoes in Japan (January 2014) in the GSJ database collection, AIST, are used.
- "Stress orientations (SHmax)" / "S-wave anisotropy (LSPD)"
- Data from the Crustal Stress Fields Database (January 2014) in the GSJ database collection, AIST, are used.
- "Upper and lower depth limits of the seismogenic layer (D10 and D90)"
- Cho, I. and Y. Kuwahara, Constraints on the three-dimensional thermal structure of the lower crust in the Japanese Islands, Earth Planets Space, 65, 855-861, 2013.
