Satsuma-iojima
火山研究解説集:薩摩硫黄島 (産総研・地質調査総合センター作成)
All text, photos and figures contained in the summary version of "Reaserches on active volcanoes: Satsuma-iojima" appear on this page.
Introduction to Satsuma-iojima
| Contents: Satsuma-iojima |
|---|
What is Satsuma-iojima?
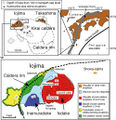 Location of Kikai Caldera and Satsuma-iojima |
 Topographic map of the Kikai Caldera |
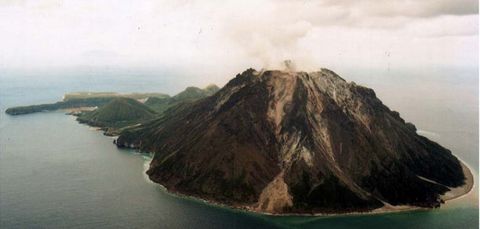
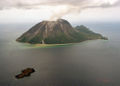
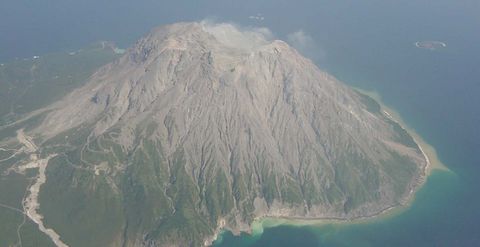
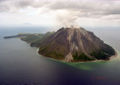
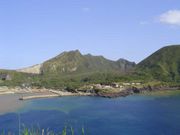
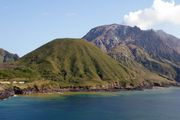
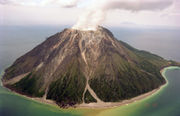
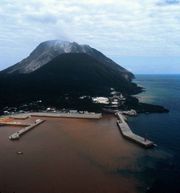
 Full view of Satsuma-iojima |
Satsuma-iojima and Mishima, the ferryboat, run by the local government |
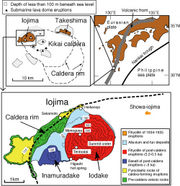
Satsuma-iojima (hereafter mostly abbreviated to ‘Iojima’ within the homepage) is a volcanic island situated about 50 km to the south of Satsuma Peninsula, the southernmost promontory of Kyushu (Fig. Locations of Satsuma-iojima and Kikai Caldera). It forms a part of rim of a huge Kikai Caldera along with Takeshima situated next to Satsuma-iojima (Topo map of Kikai Caldera).
Most volcanoes of Japan are aligned along the volcanic front and Satsuma-iojima Volcano (Kikai Caldera) is no exception situated along the volcanic front with other volcanoes of Kyushu such as Kuju, Aso, Kirishima, Sakurajima, and Kaimondake from north to south. Satsuma-iojima Volcano is at the northern end of Nansei Islands which are on the front. The front continues further to the south as a line of active volcanic islands, Kuchinoerabujima, Nakajima, and Suwanosejima.
Iojima, together with Takeshima and Kuroshima, administratively belongs to Mishima, Kagoshima Prefecture. Population is 114 (September 1, 2009) (Based on the data of the homepage of Mishima). The island is served by a village-run ferry every other day between the ports of Kagoshima and Takeshima, Iojima, and Kuroshima. The voyage takes about 3 and half hours.
There are five accommodations in the island (as at 2007).
Volcano, hot springs, and historical sites
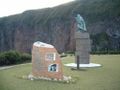 Statue of Shunkan, a Buddhist monk, and memorial monument |
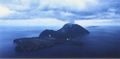
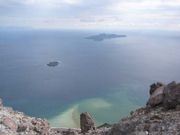
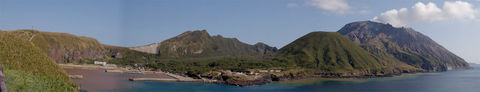
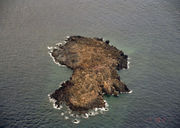
 Satsuma-iojima and Showa-iojima |
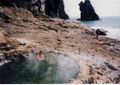 Open-air bath of Higashi Hot Spring |
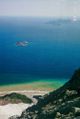 Showa-iojima and Takeshima |
The island is regarded as Kikaigashima, to which the Buddhist monk, Reverend Shunkan, was banished, described in the well-known Story of Heike. Iojima is, therefore, an island of legend. On the other hand, at Iodake occupying the eastern half of the island, a column of smoke has never ceased to rise, and hot springs are distributed everywhere within the island (See Volcanic gases and hot springs section). There is a hot spring where open-air bathing can be enjoyed on the beach. Therefore, the island can be characterized as an island of volcano and hot springs too.
Free-running peacocks are seen in this idyllic island of the south sea, but according to the ranking of volcanic activities by the Meteorological Agency, the volcano is designated as one of the 13 A-rank volcanoes for its activity (Refer to the ranking of volcanoes in Japan in the homepage of the Meteorological Agency). According to the latest study, an explosive eruption occurred about 500 to 600 years ago at Iodake (See Recent eruptions section of this version)
At the beginning of Showa period (1920s to 1930s) there was a submarine explosion that formed Showa-iojima about 2 km offshore in ENE of Iojima. The explosion was the largest explosion in Japan in the Showa period. Emission of volcanic gases is rigorous amounting to the same rank to Miyakejima, Sakurajima, and Asama volcanoes (See Recent eruptions section of this version). Continuous smoke columns rising from the summit where bare rocks are exposed remind us the fact that this is really an active volcano.
Mining of sulfur and silica stone at Iodake
At the summit of Iodake sulfur was used to be mined in the old days while in recent years silica stone was mined. Even in the Story of Heike mining operation of sulfur was mentioned.
Sulfur was derived from volcanic gas as sublimation deposit, and the silica stone is an alteration product from preexisting rocks with reactions of strongly acidic hot water condensed from the gas. Those ores, therefore, can be regarded as a gift from the volcano.
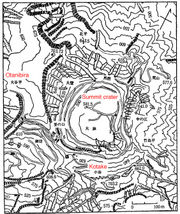
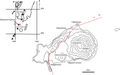
Road was constructed for sulfur mining, and stonewall-lined tracks were maintained within the summit crater. The figure on the right is a map of the summit area prepared in 1960s showing tracks on the steep inner wall of the crater edge. Sulfur refinery was built at the summit and at some time a cableway carried sulfur from Iodake to Nagahama via Inamuradake.
Mining of sulfur at the summit became un-economic in middle Showa period, but mining of silica stone commenced instead (The figure on the left). Heavy machineries were employed for silica stone mining operation, but this too was halted in 1997.
Characteristic features of Satsuma-iojima Volcano
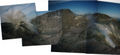 View of the summit craters (2001) |
 Summit crater bottom in 2000 |
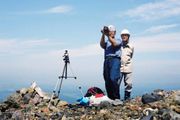
 Observation of high temperature volcanic gases |
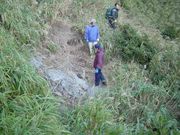
 Lunch during a survey of Iojima |
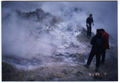
Volcanologically this is an interesting place as studies within the crater including collection of high temperature (800 to 900℃) gas is possible despite Iojima’s status as an active volcano. In general, studies within the crater are too hazardous because of the danger from eruptions, too steep a topography, brittle nature of rocks, etc. As high temperature volcanic gas does not change its compositions during migration from the magma to the ground surface, analysis of the gas would give important information as to the nature of the magma. Only a few volcanoes in the world other than Iojima, e.g., Kudriavy Volcano in Etorofu Island (Kuril’skiye Ostrova), Kuril Islands, allow direct collection of such hot volcanic gas.
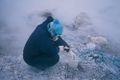
Although it is possible to enter into the crater, the area is full of acid gas at high temperature and no sightseers are allowed. The picture shown above (observation of high temperature volcanic gases) is a scene of direct collection of volcanic gas, and the person collecting the gas wears protective face mask and a pair of goggles which are essential for protection of throat and eyes. Near the high temperature fumaroles the underground temperature at several tens of cm deep reaches several 100℃ (See Heat discharge section), and heat resistant gloves have to be added as inner soles even wearing thick-soled mountaineering boots.
Despite the fact that inside of the crater is a place of dirty, hard, and hazardous environment for volcano researchers, detailed observations and studies are indispensable in providing essential information on the origin of volcanic gases, relationship between the gases and hot springs at the foot of the mountain (See Volcanic gases and hot springs section), the mode of discharge of volcanic gases from the magma, and the location and volume of the magma (See Magma system section).
In this summary version of the volcano studies, the growth history of Satsuma-iojima Volcano (See History of the volcano section), internal structure of the volcano (See Underground structure section), and volcanic activities are described for laymen fully utilizing photos and diagrams. Some of the photos are taken at hard-to-visit places such as inside of the crater and seafloor, and one can have simulated experiences how volcanologists work. We hope the readers are interested in volcanoes and volcanology. We suggest reading of the full version (in Japanese) for further information.
(Yoshihisa KAWANABE・Genji SAITO・Hiroshi SHINOHARA)
Recent eruptions
| Contents: Satsuma-iojima |
|---|
- Iodake of Satsuma-iojima volcano
Introduction
Satsuma-iojima has no documented records of eruptions before 1990s, but its fumarolic activities were mentioned in the Story of Heike and so it’s an active volcano with a long history of eruptions. It repeated small-scale eruptions with ash ejections from the summit crater of Iodake since late 1990s.
At the beginning of Showa period, a submarine eruption occurred about 2 km offshore to the east of Iojima forming Showa-iojima Island. This is the largest eruption within Japan in Showa period. According to activity classification of the Meteorological Agency, Iojima is ranked at A meaning the highest activity (Currently 13 volcanoes are A-ranked in Japan in 2008).
Recent eruptive activities
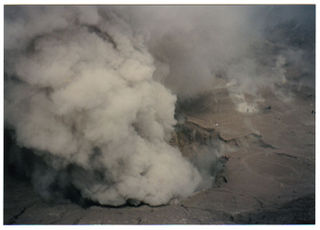
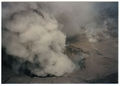
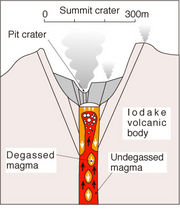
A crater about 400 m across with the depth of about 140 m exists at the summit of Iodake. Sulfur was mined in the area and within the crater from 12th century, and silica stone was mined from the same area until 1997. A vertical pit crater was formed within the summit crater since 1998 (To discriminate it from the summit crater, it is to be called ‘pit crater’), and frequently ejected ashes (See right photo: Ash ejection within the summit crater of Iodake). The ash consists of materials of altered ejecta deposited within the crater and no new magmatic materials were accompanied.
A large amount of high temperature volcanic gases have been discharged irrespective of ash eruptions from the summit crater. The discharge of the gases amounts to about 1,300 tons per day in terms of SO2. This is comparable to that of Sakurajima where frequent explosions are almost a daily phenomenon, suggesting high activity of underground magma even when no eruption is taking place.
Eruptive history during historical times
Among recent large eruptions were submarine eruptions which occurred in 1934-1935, and a new island, Showa-iojima, was created as a result where the depth of the sea used to be about 300 m. The volume of erupted magma was about 0.2 km3, one of the largest eruptions in Japan in Showa period and it was comparable to that of Heisei-Shinzan dome of Unzen Volcano in 1990-1995. This eruption occurred at the peripheral part of caldera wall between Iojima and Takeshima.
According to the Story of Heike, there were settlements in 12th century in Iojima, but no documented records are found describing eruptions. Scientific studies in recent years indicates, however, that there were explosive eruptions from the summit of Iodake 500-600 years ago accompanied with pyroclastic flows in western side of the mountain (See History of the volcano section).
(Hiroshi SHINOHARA)
History of the volcano
| Contents: Satsuma-iojima |
|---|
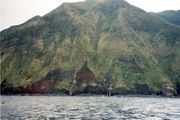
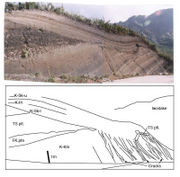
- Iojima seen from Nagahama Lava Flow
Introduction
Iojima, Takeshima, and surrounding reefs are situated about 50 km to the south of Satsuma Peninsula, Kagoshima Prefecture, Kyushu, and consist of volcanic ejecta related to submarine Kikai Caldera. Iodake in Iojima has been active with fumarolic activities and small-scale eruptions of ash to this day.
Summary of geology and history of eruptions of Satsuma-iojima Volcano along with activities related to Kikai Caldera are described below.
Kikai Caldera and accompanying ejecta
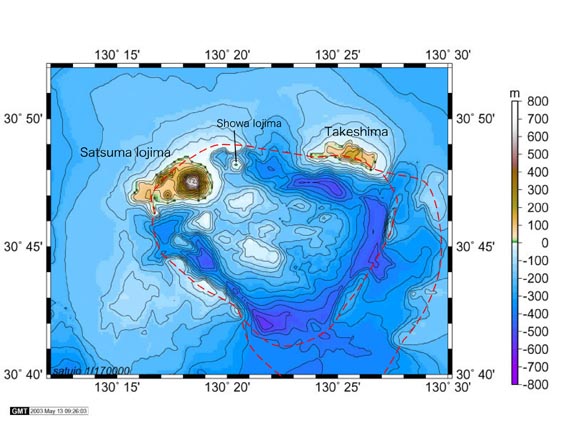
- Topographic map of the Kikai Caldera
Kikai Caldera, 20 km EW and 17 km NS is a large submarine caldera. It is shown by red broken line in the attached figure. Many post-caldera volcanoes are distributed within the submarine caldera.
At least four large eruptions accompanied with pyroclastic flows are recognized in the past. Among the large pyroclastic flow deposits, Koabiyama and Takeshima Pyroclastic Flow Deposits are identified in Iojima. Takeshima Pyroclastic Flow Deposit is originated from the latest large-scale eruption of Kikai Caldera (Kikai-Akahoya eruption) estimated to have occurred about 7,300 years before the present which reached southern tip of Kyushu (Koya Pyroclastic Flow) and caused severe damage to Jomon culture of that time. Ash fall (Akahoya Ash Fall) at the same time covered extensive areas from western Japan to Kanto area and it has been utilized as a very important time marker bed for archeology and paleo-environmental studies.
 Location of Satsuma-iojima Volcano |
 Satsuma-iojima Volcano |
Satsuma-iojima Volcano
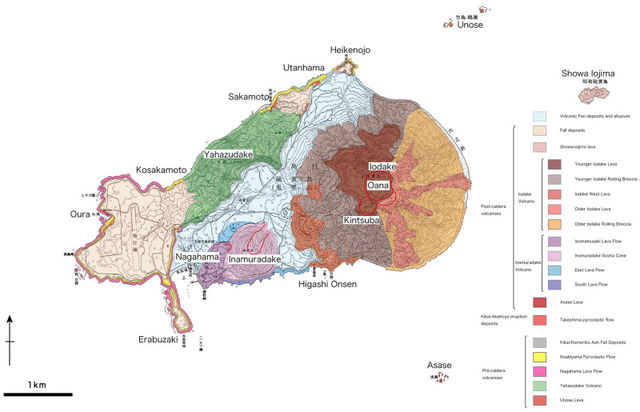
- Geologic map of the Satsuma-iojima (November 2006 edition)
Iojima is a volcanic island situated at NW edge of Kikai Caldera and consists of pre-caldera volcanic deposits preceding Kikai-Akahoya eruptions and two post-caldera volcanoes of Iodake and Inamuradake.
Pre-caldera volcano
Depositional units forming pre-caldera volcanoes in Iojima are Yahazudake Volcano, Nagahama Lava Flow, Koabiyama Pyroclastic Flow, and Kikai-Komoriko Ash Fall Deposits. Yahazudake Volcano is a small stratovolcano consisting of basalt-andesite distributed in the northern part of Iojima. Its southern half is cut and lost by Kikai Caldera wall, but lava flow topography can be partially recognized in the northern slope. On the northern sea cliff are well exposed stack of basaltic lava flows and scoria deposits of Yahazudake. On the west of Iojima are high cliffs of dacitic Nagahama Lava Flows.
Koabiyama Pyroclastic Flow Deposits, erupted at the time of caldera formation, cover all the above. At the base of Koabiyama Pyroclastic Flow Deposits is fine-grained (less than 2 cm diameter) pumice fall deposit which is overlain by the main body of pyroclastic flow. Most pyroclastic flow is strongly welded and hard. Where filling valleys it thickens and the lenses of welded parts reach 20-30 m thick.
At Heikenojo, the NE end of Satsuma-iojima, Kikai-Komoriko Tephra Fall Deposits are exposed overlying Koabiyama Pyroclastic Flow Deposits. Kikai-Komoriko Tephra Fall is understood to have originated from andesitic volcano related to Kikai Caldera. It is intercalated with Satsuma Volcanic Ash Bed originated from Sakurajima about 13,000 years ago.
Takeshima Pyroclastic Flow Deposits
About 7,300 years ago, latest large-scale pyroclastic flow eruption (Kikai-Akahoya eruption) occurred at Kikai Caldera. The ejecta of this eruption are classified into the following in the ascending order: Koya (Funakura) Pumice Fall, Funakura Pyroclastic Flow, and Takeshima Pyroclastic Flow Deposits (Ono et al., 1982).In Iojima, Koya (Funakura) Pumice Fall and Takeshima Pyroclastic Flow Depoits are distributed.
Takeshima Pyroclastic Flow is a deposit containing white pumices and distributed even in southern Kyushu beyond the intervening sea. It is called Koya Pyroclastic Flow Deposit there. In Takeshima, eastern plateau is mostly overlain up to 20 to 30 m thick of this. On the other hand in Iojima, it is thinner and distributed in Heikenojo, in an area near Sakamoto, and over Nagahama Lava Flow. Takeshima Pyroclastic Flow Deposit in Iojima is rich in accidental lithic fragments with less pumice indicating it is deposited closer to the crater.
Post-caldera volcano
Post-caldera volcanic deposits in Iojima are represented as rhyolitic Iodake and basaltic Inamuradake. After the Kikai-Akahoya eruption, rhyolitic magma resumed activities near present day Iodake about 5,200 years ago. Inamuradake erupted about 3,900 years ago. Volcanic ash and scoria ejected by those activities have deposited on Heikenojo area, Yahazudake, and Nagahama Lava Flow. Different pyroclatic fall deposits are identified with the development of intervening humus-rich soil, and according to Kawanabe and Saito (2002) eight layers of tephra fall deposits have been discriminated at the mountain foot area.
Inamuradake
Inamuradake is a small basaltic composite volcano located in the east of Satsuma-iojima settlement. It began eruptive activity about 3,900 years ago and ceased to erupt before 2,200 years ago. More than four layers of scoria fall deposits are discriminated. Several lava flows are exposed along southern coast of Iojima from Higashi Hot Spring to Nagahama. Most ejecta are products of on-land eruptions, but a surge deposit from phreatomagmatic explosion is identified within the upper member of Inamuradake Pyroclastic Fall Deposit. It is distributed over Nagahama Lava Flow near Nagahama settlement.
Iodake
Iodake is a volcano consisting of thick rhyolitic to dacitic lava flows and lava domes along with rolling (essential) breccia from the collapse of the mountain body at the time of eruption. Volcanic activity commenced about 5,200 years ago but the current surface seems to have formed after the completion of Inamuradake formation about 2,200 years ago, and no early ejecta are known exposed. Rhyolitic lava dome of the summit was formed before 1,100 years ago. After that, explosive eruptions continued up until 500 to 600 years ago. In the eruptions of 1,200 yBP and 500-600 yBP, pyroclastic flows came down to the mountain foot in the west of the volcano.
Since about 1996, the summit crater often repeats small-scale eruptions ejecting altered ash.
Post caldera volcanoes in the vicinity
Post-caldera volcanoes are distributed in the sea around Iojima. Most of them are found in the sea, but rhyolite lava is exposed at a shallow reef to the south of Iojima. In September 1934, a rhyolite island, Showa-iojima, was born by a submarine eruption about 2 km east of Iojima.
References
Kawanabe, Y. and Saito, G. (2002) Volcanic activity of the Satsuma-Iwojima area during the past 6500 years. Earth Planets and Space,vol.54,p.295-301.
Ono, K., Soya, T. and Hosono, T. (1982) Geology of the Satsuma-Io-Jima District. Quadrangle Series, Scale 1:50,000, Geol. Surv. Japan, 80p. (in Japanese with English Abstract, 5 p.).
(Yoshihisa KAWANABE)
Volcanic gases and hot springs
| Contents: Satsuma-iojima |
|---|
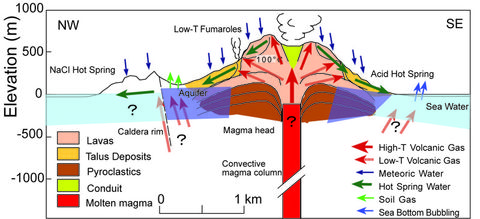
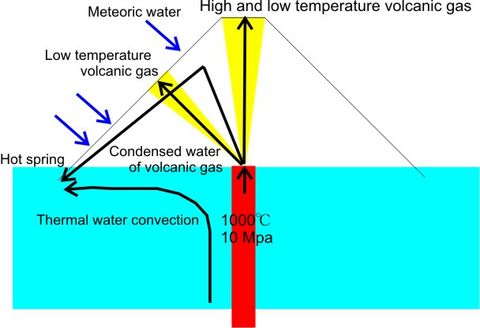
- Cross section showing differentiation process of volcanic gas and hot spring
Introduction
Iodake of Iojima actively emits volcanic plume (volcanic gas) for more than several hundreds years.
Volcanic gases released from the magma beneath the Iodake are the cause of various phenomena such as fumaroles, volcanic plume, hot springs on the beach, soil gas, discolored sea water, gas bubbles on the sea floor, formation of silicified rocks by alteration of existing rocks at the summit etc.
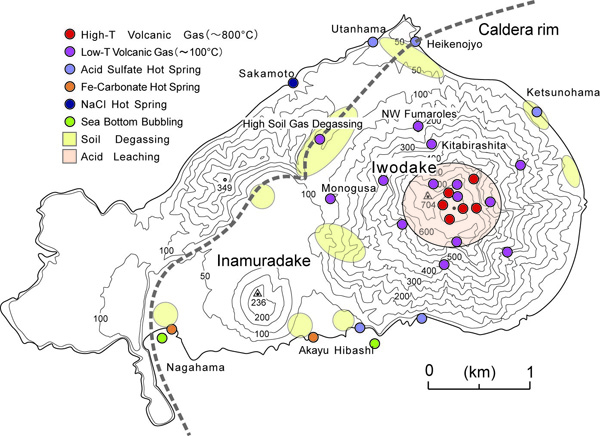
- Distribution of volcanic gas, hot spring, and soil gas
High temperature volcanic gas, low temperature volcanic gas, soil gas and hot springs are concentrically distributed with the summit of Iodake at their center (See Distribution map of gases and hot springs).
The distribution of gases and hot springs is controlled by underground movement of volcanic gases and groundwater as well as temperature distribution as shown in the cross section showing differentiation process of volcanic gas and hot spring.
Pit crater within the summit crater
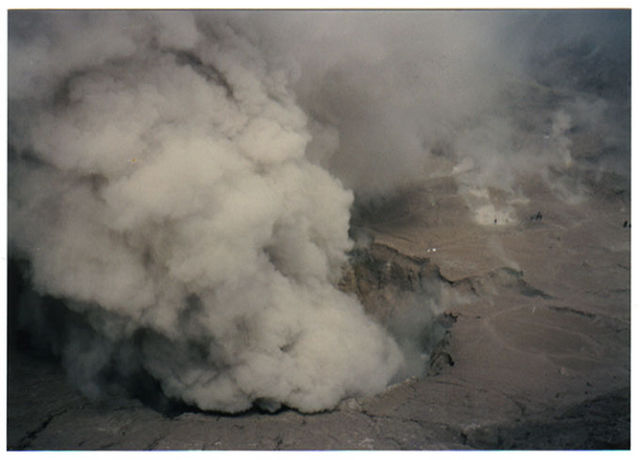
- Floor of Summit crater bottom in 2000
Within the summit crater of Iodake is a pit crater 200 m in diameter which discharges volcanic gases. The pit crater was formed accompanied by an eruption of large volume of ash in 1990s.
The photo above shows the floor of summit crater in October 2000. The diameter of the pit crater at that time was about 50 m and continuously discharging ash.
High temperature volcanic gas
High temperature fumaroles with temperatures at 800 to 900℃are distributed around the summit crater of Iodake (See Distribution map of volcanic gas and hot springs).
Near the Ohachi fumarolic zone shown in the photo, an alteration zone in whitish gray is developed around high temperature fumaroles surrounded by sublimation deposits rich in heavy metals. Especially striking is bright molybdenum blue color deposits.
At high temperature fumaroles red hot colors inside of the fumaroles can be seen even in the daytime (Photo of the highest temperature fumarole at Ohachi-Oku). The temperature registered here is just slightly lower than that of the magma suggesting the gas was released from the magma existing close to the ground surface. Because of this, high temperature volcanic gas has been studied to obtain information on the magma.
 Cluster of fumaroles at Ohachi-Oku in 1991 |
 Fumarole which recorded highest temperature in 1991 at Ohachi-Oku |
Observation of high temperature volcanic gases |
Volcanic gas from the summit
Fumaroles of various temperatures spanning from 100 to 800℃ are distributed near the summit of Iodake (See Distribution map of volcanic gas and hot springs).
Those gases of summit area show similar compositions to the high temperature volcanic gas and interpreted as cooled equivalents of the high temperature gas.
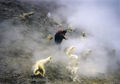
Around the group of low temperature fumaroles within the summit crater, sulfur precipitated from the volcanic gas forms chimneys.
 Low temperature fumaroles within the summit crater |
 Chimney-like sublimation deposits of sulfur around the summit crater |
Low temperature volcanic gas at foothill areas
Low temperature fumaroles at around 100℃ are distributed along valleys on the flanks of Iodake (See Distribution map of volcanic gas and hot springs).
Low temperature volcanic gas at the foot of the volcano is derived from boiling acidic water, which is produced from mixing of cooled gas and groundwater (originated from rain water). It can be compared to the steam from boiling kettle, and its temperature is close to 100℃. As water-soluble acid gas components such as sulfur dioxide and hydrogen chloride are retained in the condensed acidic hot water, low temperature volcanic gas lacks in those components.
 Low temperature fumaroles on the western foot of Iodake (Monogusa) |
 Low temperature fumaroles on the southeastern flank of Iodake |
Hydrothermally altered rocks
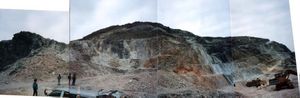
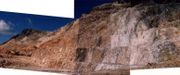
Near the summit is distributed silicastone (See Distribution map of volcanic gas and hot springs) (Photo: Otanibira silicastone quarry. Refer also for the map showing location of Otanibira and distribution of alteration zone).
Silicified rocks was formed by reaction between acid hot water condensed from volcanic gas and volcanic rocks, resulting in leaching all the components other than silica (SiO2). The silicastone was once used to be mined for house-building material.
Acidic sulfate hot springs


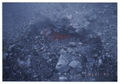
As Higashi Hot Spring shown in the left photo, strongly acidic hot springs (sulfate hot springs) (See Distribution map of volcanic gas and hot springs) are distributed along the Iodake coast.
When the hot water is mixed with seawater, dissolved alumina and silica are exsolved as white precipitates discoloring seawater (Photo shows Akayu Hot Spring on the left and Higashi Hot Spring in the center).
The sulfate acidic hot spring is formed when acidic fluid formed by mixing of volcanic gas and groundwater reacts with volcanic rocks to dissolve some components of the rocks.
Springs with dissolved iron-bearing carbonic acid
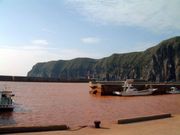
On the coast of Inamuradake (See Distribution map of volcanic gas and hot springs) are weakly acidic iron-bearing carbonate salt springs (Nagahama Hot Spring and Akayu Hot Spring) are distributed. There, precipitates of iron hydroxides are formed resulting in discolored sea water. At Iojima Port is Nagahama Hot Spring and seawater within the port is discolored by reddish brown precipitates of iron.
Hot brine spring
Seawater is heated to form hot brine springs at Sakamoto Hot Spring and Showa-iojima (See Distribution map of volcanic gas and hot springs).
Gas from the soil
In wide low ground within the Iojima, volcanic CO2 is discharged as soil gas (See Distribution map of volcanic gas and hot springs).
Volcanic CO2 gas discharge is particularly abundant around Iodake, caldera edge, and where hot springs are, and where the gas is abundantly discharged ground temperature tends to be high (Photo: Soil gas discharge zone). Volcanic CO2 gas in the soil is interpreted to correspond to the remaining gas after acid water-soluble components are removed during cooling and reaction with groundwater while rising from the depths.
Separated gas on the seafloor
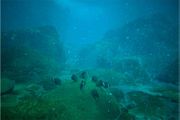
Around the Higashi Hot Spring and the Showa-iojima (See Distribution map of volcanic gas and hot springs), separated gas bubbles are seen rising from the sea floor (Photo: Separated gas on the seafloor).
Similar with soil gases, seafloor gas consists of remaining components of volcanic gases after dissolving into seawater.
(Hiroshi SHINOHARA)
Heat discharge
| Contents: Satsuma-iojima |
|---|
- Map showing ground surface temperature distribution in the Iodake summit area
Introduction
In an active volcano, high ground temperature areas exist reflecting high temperature underground magma. High ground temperature is resulted from heat transfered through conduction to surrounding rocks from the magma, discharge of volcanic gases from the magma, and formation of hydrothermal system with permeation of groundwater and convection of hot water. With observation of high temperature areas we can get information on the underground magma and accompanying hydrothermal system.
Ground temperature changes with sunshine and weather conditions, but in the place where it is influenced by magmatic heat the temperature tends to be higher than other areas. Those areas are called heat anomaly zone (or temperature anomaly zone). To study heat anomaly zone of Iodake, data have been collected using satellite as well as on-site observations. In on-site observations, both ground surface temperature measurements with infrared imaging instrument from the distance and direct measurements with thermocouples are employed. Results of observations of Iodake heat anomaly areas are shown next.
Characteristic features of thermal activity
Ground surface temperature distribution of Iodake
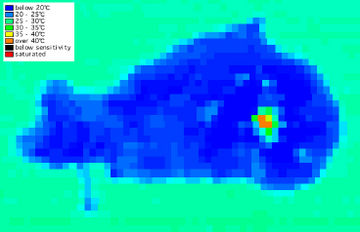

The figure shown above is surface temperature distribution of Iojima on the night of March 7th 1995. The temperature anomaly areas distributed on the summit and flanks of Iodake roughly correspond to the distribution of fumaroles, and thus are judged to be resulting from volcanic activities. As observations using satellite can be done regularly, they are very useful to reveal long-term variations as are mentioned in more detail in the full version of this document. Image with higher resolution is shown next.
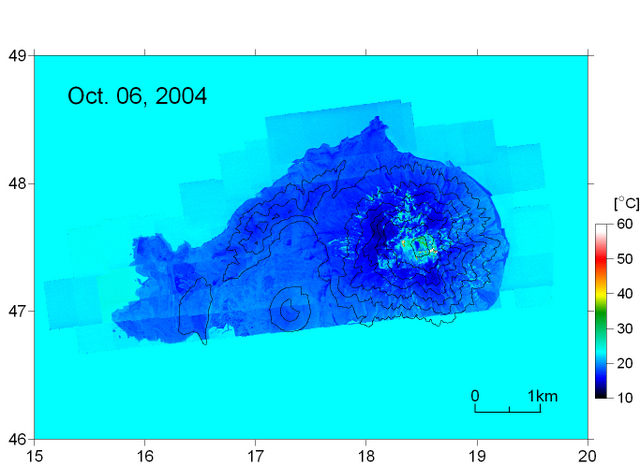
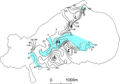
- Ground surface temperature distribution observed from the Cessna aircraft
This distribution map of ground surface temperature of Iojima was prepared using data from an infrared imaging instrument on board a Cessna aircraft at an altitude of 1,500 m on October 6th 2004. The resolution (several m) of this image by Cessna aircraft is far superior to that of satellite (120 m). Thus,for example, detailed surface temperature distribution obtained indicates that temperature anomaly was not restricted to the summit crater floor but spread to the mountain foot areas, although absolute temperature was not very high. Next, let’s look at the summit area of Iodake more closely.
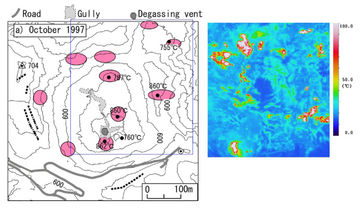
Ground surface temperature distribution map of Iodake summit area observed from Cessna aircraft is shown along with topography and fumarole distribution of the same area (Distribution of ground surface temperature on the crater floor of Iodake from Cessna aircraft). Highest temperature area clearly corresponds to the area of fumaroles. Details of crater floor area data obtained on the ground observations are examined next.

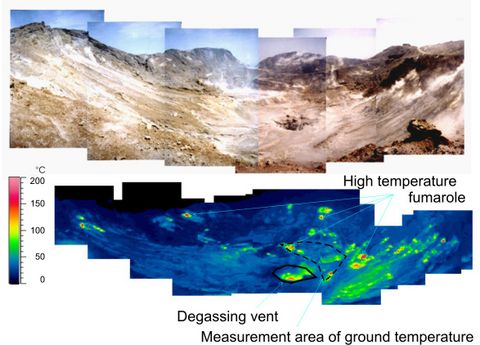
- Surface temperature distribution at the bottom of the crater (observation on April 17, 1997)
Photo shown above is a view of inside of crater from the edge of the crater. In the center of the photo is the pit crater from which high temperature volcanic gas is discharged. The photo below is the view with infrared imaging device of the same place showing ground surface temperature distribution. The photo clearly shows that the pit crater and its surrounding area, especially on the crater wall, have high temperature (red to yellow colored). The distribution of high temperature part with up to 800℃ corresponds to that of fumaroles. Most of the crater floor area is covered by low temperature area (shown in green to blue colors) which corresponds to around 100℃ in temperature where low temperature fumaroles and low temperature ground are developed. Such correspondences became clear with on-site observations of ground surface temperature measurements and thermocouple measurements of underground and fumarole temperatures.
Relationship between ground surface and underground temperatures
As has been seen in the preceding sections, the relationship between ground surface and underground temperatures became clear through simultaneous measurements at representative locations shown within the dotted lines in the distribution map of ground surface temperatures at the Iodake summit crater.
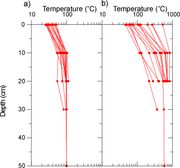
a)Ground surface temperatures of 20 to 50℃ (Fig on the right shows underground temperature gradient curve a)) correspond to anomalous underground temperature areas with low temperature fumaroles of around 100℃ and surrounding areas.
b)Ground surface temperature of 50 to 100℃ (Fig on the right shows underground temperature gradient curve b)) corresponds to high temperature fumaroles with over 100℃ and surrounding underground temperature anomaly areas.
Changes in thermal activities in the past
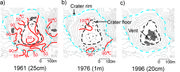
The conditions of crater floor area are not always constant. The diagram (secular variation of underground temperature) shows changes of underground temperatures in crater floor. Before 1976, the underground temperatures at the bottom of the crater were almost always lower than the boiling point of water and high temperature fumaroles were distributed on the crater wall. In 1996 most underground parts on the the crater floor were higher than the boiling point. This corresponds to the changes of crater floor which took place after 1991; Pit crater was formed in 1991 and it has grown steadily since. Let’s examine the thermal activities of crater floor further.
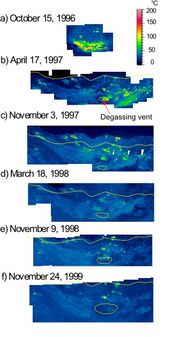
The diagram of secular changes of Iodake crater floor temperatures shows enlargement of pit crater and accompanying ground surface temperature changes with time. The diameters of the pit crater were 26.5, 27.9, 34.9, 40.5, and 64.2 m for April 1997, November 1997, March 1998, November 1998, and November 1999, respectively.
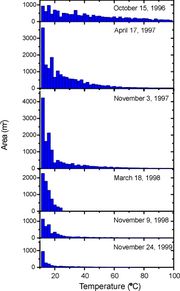
At the beginning high temperature volcanic gas was emitted, but in 1999 the gas became low in temperature and since 1997, cumminuted solid (ash) was occasionally ejected and deposited around the crater. Low temperature areas were clearly recognized around the crater in 1998 and 1999 data.
The areal changes of temperature anomalies are clearly seen in the right diagram (areas of temperature anomalies in the crater floor of Iodake from ground measurements). With the formation of pit crater within the crater floor, fumarole activities increased for a short while, but temperatures in the whole crater floor and emission of smoke decreased in general since 1997.
Iodake magma – hydrothermal model
As shown above, three types of thermal activities are discriminated at Iodake.
- Discharge of 100 to 900℃ volcanic gases from the summit fumaroles
- Discharge of low temperature volcanic gases of about 100℃ at the foot of the volcano
- Areas surrounding fumaroles with high ground temperatures called ‘fumarole zones’.
In additions to these, hot springs at coastal areas (See Volcanic gases and hot springs section) may be added.
Geochemical analysis of the volcanic gases discharged from the summit fumaroles indicates that the gases are derived from magmatic source. Gases discharged from the foot of the volcano are mixtures of magmatic gas and meteoric water. Magmatic gases are mixed in coastal hot springs.
Fumarolic zones are distributed around the fumaroles at the summit and foot of the volcano. Thus their source is interpreted to be diffused and modified volcanic gases migrated through fissures in the ground.
In summary, hydrothermal system of Iodake can schematically be shown in the model diagram on thermal activities.
- Schematic model of thermal conduction
(Nobuo MATSUSHIMA)
Underground structure
| Contents: Satsuma-iojima |
|---|
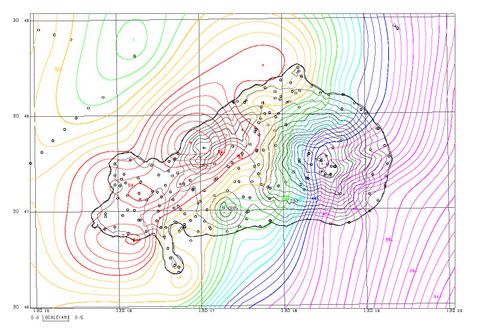
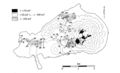
- Gravity anomaly of Iojima
Introduction
Geophysical prospecting is one of the powerful methods to study underground structure of a volcano. Results of a contract research, ‘Feasibility study of power generation method on a volcano’ carried out from 1975 to 1977 by Japan Electric Machine Industry Association in the Sunshine Project of Industrial Science and Technology Agency, are summarized below. The results were published partly in Geological Survey of Japan (1976 and 1980).
Also introduced is a study of spontaneous potential observations (Kanda and Mori, 2002). Although not referred to in this document, regional magnetic anomaly distribution was studied by Geological Survey of Japan (1980).
Summary of the survey
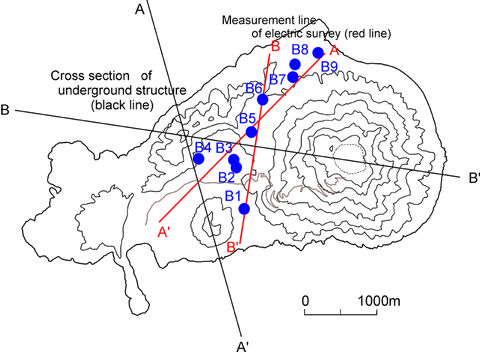
- Survey points and observation lines of electrical exploration
Electrical resistance, density, and magnetic susceptibility (induced magnetic strength of a material by magnetic field) vary on the type of earth material. Underground structure can be deduced from measurements of these.
In Iojima, measurements at drill holes of about 100 m depths, electrical survey at mountain foot areas, gravity measurements, spontaneous potential survey, and aeromagnetic survey have been carried out. Locations of drill holes, measurement lines for electrical survey, positions of cross sections of magnetic and gravity analyses are shown in the upper figure (Locations of measurements and electrical survey lines).
From the measurements at drill holes, data on groundwater levels and temperatures at the bottoms of the holes are obtained. Drill hole bottom temperature represents ground temperature at that depth.
In electrical prospecting an electric current is passed between a pair of electrodes, and electrical resistance of the ground is measured. Underground structure below the line connecting observation points can be deduced from the data obtained.
In gravity survey, densities of underground materials are known from surface gravity values.
In magnetic survey, magnetic susceptibilities of underground materials are known from the measurement at the ground surface. For the following detailed descriptions, measurements were carried out with air-borne instrument installed in an aircraft.
Survey utilizing drill holes
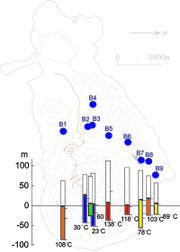
Groundwater level and drill hole bottom temperature for each hole are shown in a diagram (Groundwater level and drill hole bottom temperature). Groundwater is partially derived from permeated rainwater, but the level is influenced from the ease of underground flow. If flowing is difficult the level would rise and vice versa. At Iojima the groundwater level is roughly equal to the level of sea and seems to flow easily.
On the other hand, bottom temperature is not uniform. A high temperature suggests existence of possible heat source.
Electrical explorations
Specific resistance is measured in electrical prospecting. The specific resistance is a measure of ease for electric current to flow, and the larger the value the more difficult for current to flow. Underground specific resistance values depend on the types of rocks, existence of fresh groundwater and sea water, and temperature. Specifically, in the volcanic areas, specific resistance may become anomalously small if water contents of the rocks are high or alteration of rocks is advanced. Therefore, measurements of specific resistance give good information for the underground structure.
Diagrams shown below (Specific resistance (Cross section A) and specific resistance structure (Cross section B)) were obtained with an electrical prospecting method called Shlumberger method and show underground structure of Iojima based on specific resistance. It shows that in Iojima specific resistance below groundwater level is anomalously low at 1-4Ω・m. The two reasons why it is so may be due to existence of permeated seawater under Iojima and widespread development of volcanic alteration of rocks.
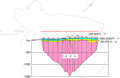 Cross section of specific resistance along a line (Cross section A) |
 Cross section of specific resistance along a line (Cross section B) |
Gravity survey
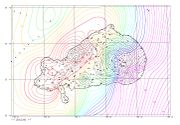
Distribution of gravity anomaly obtained through gravity measurements reflects the differences of densities of underground materials.
Data shown by Komazawa et al. (2005) indicate that the gravity of Iojima tends to decrease from NW to SE directions. This is interpreted as reflecting structure of caldera. That is, the materials filling the depression of caldera have lower densities than those of surrounding areas and the filling materials tend to thicken from NW to SE of the island.
Magnetic and density structures
Earth’s magnetic field is locally disturbed as magnetic characteristics of rocks are different from place to place. The difference between standard value of magnetic strength and local strength is called magnetic anomaly. An estimation of underground structure is possible from the magnetic anomaly. The magnetic anomaly can be measured from an aircraft to obtain more generalized figure.
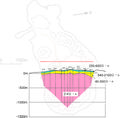
Air-borne magnetic anomaly survey was carried out near Iojima, and together with the gravity anomaly data underground structure was estimated along two cross sections (See Analyzed cross section A and Analyzed cross section B below). In practice, rock bodies with different magnetic strengths (shown in blue) and density contrasts (shown in red lines) are recognized.
 Cross section for magnetic anomaly and density structure along line A-A’ |
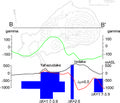 Cross section for magnetic anomaly and density structure along line B-B’ |
Survey on spontaneous potential
Spontaneous potential is naturally occurring electric potential in the earth and shows anomaly reflecting movement of groundwater or ground hot water. Spontaneous potential is measured with electrodes set up on the ground surface. As measuring method is simple, it has been used in prospecting of ores and hot springs.
Where underground water flows immediately below the ground surface, upstream side tends to show positive potential while downstream side negative. In mountainous region, the higher the altitude the lower the potential and this is called topographic effect. It is due to water flowing down from the summit to the foot.
On the other hand, anomalies in spontaneous potential occur with the thermal water flow: Where thermal water rises positive anomaly and where it descends negative anomaly would appear. Anomaly does not occur with the movement of volcanic gas or steam. The size of anomaly varies depending on the specific resistivity of the rock. If the rock has low specific resistivity (better conductor) the amplitude of anomaly tends to be small and vice versa.
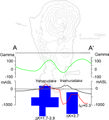
The diagrams below show the results of measurements of spontaneous potentials in Iojima for 1975 and 1999. Both diagrams show positive anomaly on the western flank of Iodake. This may represent flow of underground water. In the diagram for 1999, positive anomaly was observed at the summit area probably suggesting movement of thermal water accompanying fumarolic activity.
 Distribution of spontaneous potential (1975) |
 Distribution of spontaneous potential (1999) |
References
Geological Survey of Japan (1976) Report of geothermal basic survey in Japan, No. 3 Nansei Shoto, 90p. Geol. Surv. Japan.
Geological Survey of Japan (1980) Total intensity aeromagnetic map, No. 25-1 Coast of Osumi Peninsula-Yakushima Area, Scale 1:200,000, Geol. Surv. Japan.
Kanda, W. and Mori, S. (2002) Self-potential anomaly of Satsuma-Iwojima volcano. Earth Planets Space, vol.54, p.231-238.
Komazawa, M., Nawa, K., Murata, Y., Makino, M., Morijiri, R., Hiroshima, T., Yamazaki, T., Nishimura, K. and Okuma, S. (2005) Gravity map series (bouguer anomalies), No.22 Gravity map of Yaku Shima district, Scale 1:200,000, Geol. Surv. Japan.
(Nobuo MATSUSHIMA)
Magma system
| Contents: Satsuma-iojima |
|---|
- Model showing evolution of magma reservoir
Introduction
At Satsuma-iojima vigorous volcanic activities have continued even after the formation of huge caldera about 7,300 years ago. A large amount of magma (over 19 km3) has erupted within caldera which is mainly submarine. It is believed, therefore, that a large underground magma reservoir exists even after the caldera was formed.
At Iojima after the caldera formation, Iodake and Inamuradake peaks were created with eruption and high temperature gas of 800-900℃ has been continuously emitted from Iodake. The gas is mostly magmatic in origin.
The amount of gas reaches 1,300 tons per day estimated from measurements of emitted sulfur dioxide (SO2). To continue emittance of such huge amount of gas from the magma, enormous amount of magma has to degas.
In this chapter, an interpretation of the movement of underground magma from 7,300 years ago to this day is presented.
Activities of the magma
As the temperature of volcanic gas emitted from the Iodake summit crater is very high (up to 800-900℃) it is estimated that the gas reaches ground surface immediately after separation from the magma. In other words the magma seems to be present close to the ground surface.
Ninety-seven percent of the high temperature volcanic gas is steam. As water is readily dissolve in the magma, emission of water only occur if the magma is at comparatively low pressures. This further suggests that the magma exists close to the ground surface.
The amount of water discharged from the magma is estimated to be about 40,000 tons (equivalent to a liquid water cube with sides of 34 m at room temperature under one atmospheric pressure) per day based on the chemical and isotopic compositions of the gas and amount of SO2 emitted. For this much of water is to be discharged the actively degassing magma should exist at shallow depths.
The question is how much magma at what depths degassing.
The answer can be given from estimation of original amount of gas contained in the magma. Here only the conclusion is shown, but it is over 4 million tons of magma degassing every day at about 20 atmospheres pressure.
The pressure is equivalent of several hundred meters depth at Iodake summit crater. As the height of Iodake is 704 m, degassing must be occurring above sea level. According to observations with broad band seismograph the tremors probably related to the degassing are centered above sea level. Therefore it seems that the magma head (top of magma column extended from magma reservoir at depths) is located at this level and degassing has been occurring there. Calculated amount of the magma from which degassing occur is equivalent of a 100 m cube per day. This corresponds to 0.3 to 0.4 km3 magma degassing per year.
Mechanism of degassing
Referring to the old documentation such as the Story of Heike as well as the degrees of alteration of rocks, it is believed that huge amount of degassing has continued over 1,000 years. Even the facts that long-term variation of degassing (strictly speaking the amount of degassing before 1970s when observation of degassing began is not known) and possible differences of gas compositions depending on different magmas (it is understood that two types of magma exist underground) are taken into account, the total amount of degassed magma must be over 100 km3 in the last 1,000 years.
No evidence is available for existence of this much magma at such shallow depths. A large amount of magma can only exist at great depths. For a large degassing to occur, the magma should be at low pressure environment.
This dilemma can be explained by a process of magma convection in a conduit. If a conduit connects low pressure environment at shallow depths with a magma reservoir at depths, the magma can rise through the conduit and is brought to low pressure environment. As degassed magma has higher density than non-degassed magma it can sink back to the reservoir. This process is repeated resulting in a large amount of magma degassing.
Current magma reservoir
As was mentioned earlier, a large amount of magma (over 19 km3) erupted since the formation of caldera. Also degassed magma not erupted and stayed underground is estimated to be over 100 km3. Therefore, it is concluded that a large magma reservoir must have existed constantly continuing eruptions even after the formation of caldera 7,300 years ago.
New questions arisen here are where such magma reservoir is, what the nature of it is, and how it behaves.
Based on petrological analyses, analyses of gas compositions contained in the melt, geochemical analyses of the gas, and geophysical observations, the image of the magma reservoir is gradually emerging as shown in the left figure.
The upper surface of the magma reservoir is estimated to be at about 3 km depth, and it consists of basaltic magma at the bottom overlain by rhyolitic magma at the top with the intermediate portion consisting of andesitic magma from mixing of the basalt and rhyolite. Basaltic magma (1130℃) is hotter than rhyolitic magma (970℃) and richer in volcanic gas supplying the gas to rhyolite magma. Discharge of a large amount of gas mentioned earlier is due to the rise of rhyolitic magma through the vent and degassing near the ground surface. Degassed rhyolite magma sinks back to the bottom of the rhyolite layer and the gas is replenished through andesitic magma from underlying basaltic magma. In other words, most of the gas emitted from the surface is originated from basaltic magma existing at great depths.
Evolution of magma reservoir

Process of how the magma reservoir was formed is interpreted next.
Rocks and melt inclusions since the formation of the caldera about 7,300 years ago to the eruption of Showa-iojima in 1934-1935 have been closely examined and an image of magma reservoir evolution shown in the right figure has emerged.
Immediately before the caldera-forming eruption, a large rhyolite magma reservoir existed at 3-7 km depths. Rhyolite magma erupted through catastrophic outburst.
Part of rhyolitic magma escaped from erupting and remained in the reservoir. From the analyses of the rocks, a rise of basaltic magma to the bottom of the rhyolitic magma reservoir is suggested. Rhyolite eruption occurred about 5,200 years ago and formation of Iodake began. About 3,000 years ago basaltic magma started to erupt to form Inamuradake.
Rhyolite magma restarted erupting about 2,200 years ago and continued till 500 years ago with the formation of current Iodake dome. During this Iodake forming activities it is suspected that a basaltic magma reservoir existed beneath the rhyolitic magma reservoir. Within the rhyolitic magma reservoir, emission of volcanic gas became active by magma convection in a conduit. This continues to this day. After the last Iodake eruption (about 500 years ago), basaltic magma intruded into rhyolitic magma reservoir with resultant formation of mixed andesitic magma. In the eruptions of 1934-1935, rhyolitic magma with little andesitic magma formed Showa-iojima.
(Kohei KAZAHAYA・Genji SAITO)
Volcanic hazards
| Contents: Satsuma-iojima |
|---|

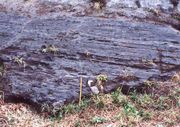
- Volcanic bombs and pyroclastic flow deposits on the western foot of Iodake
As Satsuma-iojima is an active volcano, emissions of volcanic gas accompanied with micro-earthquakes are continuing. Also occasionally eruptions with ejections of altered volcanic ash are seen.
In this chapter, possible volcanic hazards in Iojima are briefly discussed.
Volcanic gas
About 1,300 tons of sulfur dioxide (SO2) is emitted from the summit crater everyday. SO2 is a cause of acid rain and eats away metals. It causes damage to human respiratory system and mucous membrane. Even at low concentrations it may trigger asthmatic symptoms at long exposure let alone at high concentrations. At worst acute attack may lead to deaths. Luckily, the main source of the gas is at high altitude at the summit crater and the settlements are on the windward side of the prevailing wind lessening the danger of people continuously being exposed to highly concentrated SO2 gas. However, proper precautions are essential when approaching the crater area, including paying attention to wind direction and wearing gas mask if necessary.
Eruptions of volcanic ashes and pumices
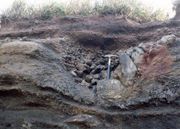
Volcanic bombs and pyroclastic flow deposits on the western foot of Iodake
Amount of ashfall accompanying small-scale eruptions since 1998 have been small and their influence to the daily life was limited. However, eruption deposits around Iodake in the last 1,000 years reach over 1 m inthickness suggesting that if the eruption becomes more active than the present, the amount of ejecta would become large. Increased ash ejection would cause not only damage to agricultural produces and health, but also increased possibility of debris flow with rainfall.
The latest eruption accompanying magmatic material occurred about 500-600 years ago with ejection of volcanic bombs and collapsed eruption column-type pyroclastic flow reaching foot of Iodake. At about 1,100 -1,200 years ago there was a pumiceous eruption with some pumice likely to have drifted to Takeshima. With the increased magmatic activities, similar ejections of bombs and pumices, and pyroclastic flows reaching mountain foot areas may occur. To lessen the damage from such eruptions, surveillance of volcanic activities has to be strengthened along with preparation of hazard map to safely evacuate people.
Lava flows and collapses of the mountain
In the last 1,200 years, no lava flows have spilled from Iodake. On the other hand, in the submarine eruption of 1934-1935 when Showa-iojima was formed, submarine lava dome was created from erupted lava. Also, as high temperature volcanic gas has been continuously emitted, magma head (top pf magma column within the vent) seems to exist close to the ground surface making it a definite possibility for the magma breaking out to the ground surface or seafloor. In the case of highly viscous rhyolitic magma, if the mountain body is pushed up by rising magma it would deform causing a collapse. If it occurs, the damage is not only from the collapsed body, but also from tsunami may be expected if the collapsed materials are carried to the sea.
Submarine eruptions
In the submarine eruption of 1934-1935, not only a submarine dome was created on the seafloor and Showa-iojima emerged breaking the sea surface, but also huge-sized pumices were ejected and they deposited in the surrounding seafloor. The eruption was luckily at great depths and rhyolite magma upwelled rather quietly but not explosively. However, if the eruption is to occur at shallow water or effusive rate is high, explosive phreatomagmatic eruptions may result.
In the past, at the late stage of Inamuradake activity, a phreatomagmatic explosion occurred west of Inamuradake, near present-day Nagahama settlement with ejection of blocks onto the surrounding areas and a pyroclastic surge (Kawanabe and Saito, 2002). As phreatomagmatic explosion can occur for rhyolitic magma, accurate prediction of activity and timely evacuation are essential.
References
Kawanabe, Y. and Saito, G. (2002) Volcanic activity of the Satsuma-Iwojima area during the past 6500 years. Earth Planets and Space, vol.54, p.295-301.
(Yoshihisa KAWANABE)