Heat discharge
火山研究解説集:薩摩硫黄島 (産総研・地質調査総合センター作成)
| Contents: Satsuma-iojima |
|---|
- Map showing ground surface temperature distribution in the Iodake summit area
Introduction
In an active volcano, high ground temperature areas exist reflecting high temperature underground magma. High ground temperature is resulted from heat transfered through conduction to surrounding rocks from the magma, discharge of volcanic gases from the magma, and formation of hydrothermal system with permeation of groundwater and convection of hot water. With observation of high temperature areas we can get information on the underground magma and accompanying hydrothermal system.
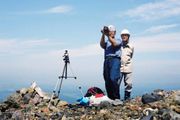
Ground temperature changes with sunshine and weather conditions, but in the place where it is influenced by magmatic heat the temperature tends to be higher than other areas. Those areas are called heat anomaly zone (or temperature anomaly zone). To study heat anomaly zone of Iodake, data have been collected using satellite as well as on-site observations. In on-site observations, both ground surface temperature measurements with infrared imaging instrument from the distance and direct measurements with thermocouples are employed. Results of observations of Iodake heat anomaly areas are shown next.
Characteristic features of thermal activity
Ground surface temperature distribution of Iodake
The figure shown above is surface temperature distribution of Iojima on the night of March 7th 1995. The temperature anomaly areas distributed on the summit and flanks of Iodake roughly correspond to the distribution of fumaroles, and thus are judged to be resulting from volcanic activities. As observations using satellite can be done regularly, they are very useful to reveal long-term variations as are mentioned in more detail in the full version of this document. Image with higher resolution is shown next.
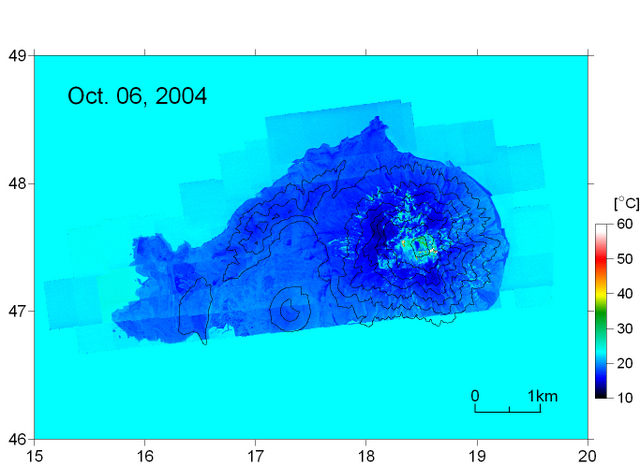
- Ground surface temperature distribution observed from the Cessna aircraft
This distribution map of ground surface temperature of Iojima was prepared using data from an infrared imaging instrument on board a Cessna aircraft at an altitude of 1,500 m on October 6th 2004. The resolution (several m) of this image by Cessna aircraft is far superior to that of satellite (120 m). Thus,for example, detailed surface temperature distribution obtained indicates that temperature anomaly was not restricted to the summit crater floor but spread to the mountain foot areas, although absolute temperature was not very high. Next, let’s look at the summit area of Iodake more closely.
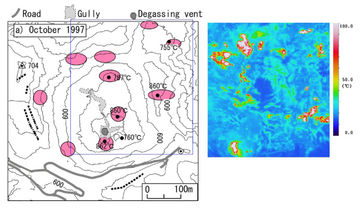
Ground surface temperature distribution map of Iodake summit area observed from Cessna aircraft is shown along with topography and fumarole distribution of the same area (Distribution of ground surface temperature on the crater floor of Iodake from Cessna aircraft). Highest temperature area clearly corresponds to the area of fumaroles. Details of crater floor area data obtained on the ground observations are examined next.

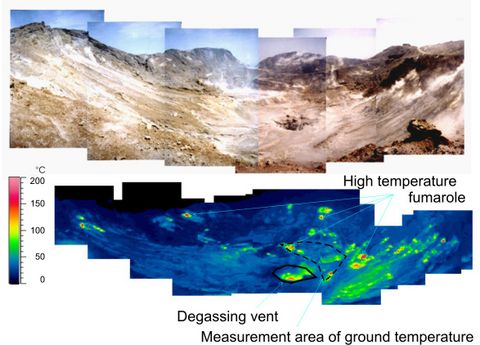
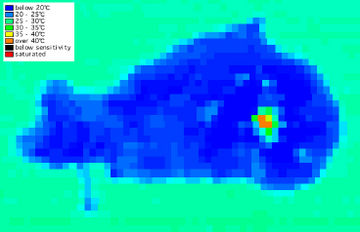
- Surface temperature distribution at the bottom of the crater (observation on April 17, 1997)
Photo shown above is a view of inside of crater from the edge of the crater. In the center of the photo is the pit crater from which high temperature volcanic gas is discharged. The photo below is the view with infrared imaging device of the same place showing ground surface temperature distribution. The photo clearly shows that the pit crater and its surrounding area, especially on the crater wall, have high temperature (red to yellow colored). The distribution of high temperature part with up to 800℃ corresponds to that of fumaroles. Most of the crater floor area is covered by low temperature area (shown in green to blue colors) which corresponds to around 100℃ in temperature where low temperature fumaroles and low temperature ground are developed. Such correspondences became clear with on-site observations of ground surface temperature measurements and thermocouple measurements of underground and fumarole temperatures.
Relationship between ground surface and underground temperatures
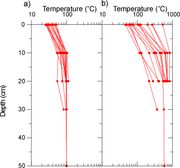
As has been seen in the preceding sections, the relationship between ground surface and underground temperatures became clear through simultaneous measurements at representative locations shown within the dotted lines in the distribution map of ground surface temperatures at the Iodake summit crater.
a)Ground surface temperatures of 20 to 50℃ (Fig on the right shows underground temperature gradient curve a)) correspond to anomalous underground temperature areas with low temperature fumaroles of around 100℃ and surrounding areas.
b)Ground surface temperature of 50 to 100℃ (Fig on the right shows underground temperature gradient curve b)) corresponds to high temperature fumaroles with over 100℃ and surrounding underground temperature anomaly areas.
Changes in thermal activities in the past
The conditions of crater floor area are not always constant. The diagram (secular variation of underground temperature) shows changes of underground temperatures in crater floor. Before 1976, the underground temperatures at the bottom of the crater were almost always lower than the boiling point of water and high temperature fumaroles were distributed on the crater wall. In 1996 most underground parts on the the crater floor were higher than the boiling point. This corresponds to the changes of crater floor which took place after 1991; Pit crater was formed in 1991 and it has grown steadily since. Let’s examine the thermal activities of crater floor further.
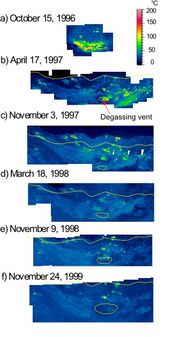
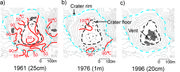
The diagram of secular changes of Iodake crater floor temperatures shows enlargement of pit crater and accompanying ground surface temperature changes with time. The diameters of the pit crater were 26.5, 27.9, 34.9, 40.5, and 64.2 m for April 1997, November 1997, March 1998, November 1998, and November 1999, respectively.
At the beginning high temperature volcanic gas was emitted, but in 1999 the gas became low in temperature and since 1997, cumminuted solid (ash) was occasionally ejected and deposited around the crater. Low temperature areas were clearly recognized around the crater in 1998 and 1999 data.
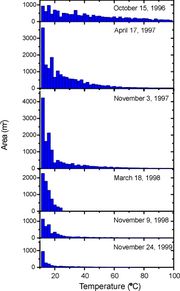
The areal changes of temperature anomalies are clearly seen in the right diagram (areas of temperature anomalies in the crater floor of Iodake from ground measurements). With the formation of pit crater within the crater floor, fumarole activities increased for a short while, but temperatures in the whole crater floor and emission of smoke decreased in general since 1997.
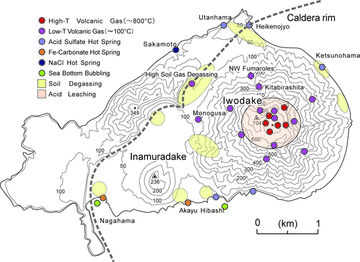
Iodake magma – hydrothermal model
As shown above, three types of thermal activities are discriminated at Iodake.
- Discharge of 100 to 900℃ volcanic gases from the summit fumaroles
- Discharge of low temperature volcanic gases of about 100℃ at the foot of the volcano
- Areas surrounding fumaroles with high ground temperatures called ‘fumarole zones’.
In additions to these, hot springs at coastal areas (See Volcanic gases and hot springs section) may be added.
Geochemical analysis of the volcanic gases discharged from the summit fumaroles indicates that the gases are derived from magmatic source. Gases discharged from the foot of the volcano are mixtures of magmatic gas and meteoric water. Magmatic gases are mixed in coastal hot springs.
Fumarolic zones are distributed around the fumaroles at the summit and foot of the volcano. Thus their source is interpreted to be diffused and modified volcanic gases migrated through fissures in the ground.
In summary, hydrothermal system of Iodake can schematically be shown in the model diagram on thermal activities.
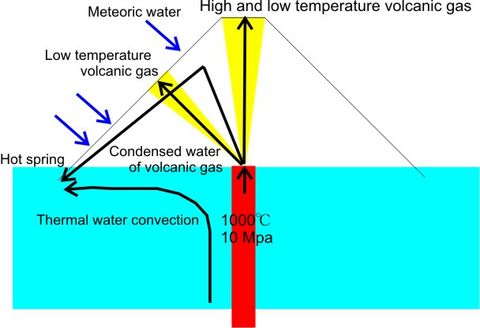
- Schematic model of thermal conduction
(Nobuo MATSUSHIMA)