
Select the background map
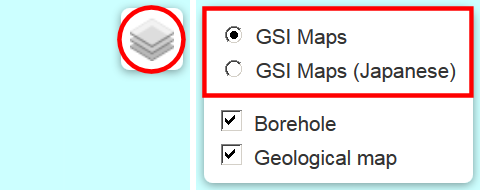
1. Using the mouse, move the cursor to the ![]() icon in the upper right corner of the map screen.
icon in the upper right corner of the map screen.
2. Select a background map from the layer list of maps. Currently, the following GSI Maps are available:
- GSI Maps (English)(default setting)
- GSI Maps (Japanese)
Display the geological map
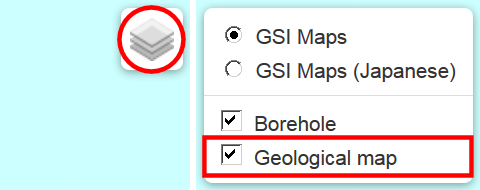
1. Move the cursor to the ![]() icon in the upper right corner of the map screen.
icon in the upper right corner of the map screen.
2. Select the box for “Geological map” (the Geological map is selected by default).
Adjust the opacity of the geological map
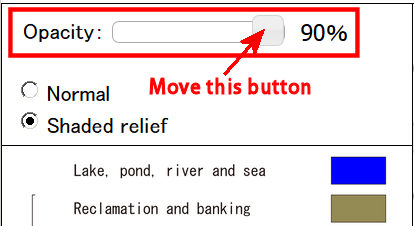
Slide the “Opacity” bar in the upper left corner of the screen. A smaller value gives a more transparent map.
Toggle the shaded relief effect on/off
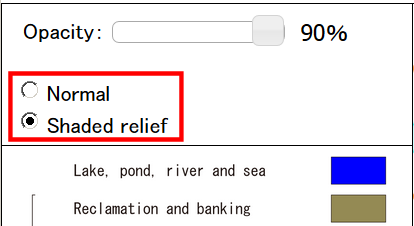
Select the radio button in the upper left corner of the screen for a “Normal” or “Shaded relief” map.
Query category values of the geological map
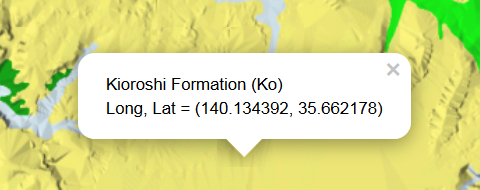
Click the geological map displayed on the map screen.
Display locations of borehole data
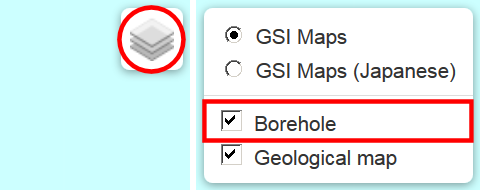
1. Move the cursor to the ![]() icon in the upper right corner of the map screen.
icon in the upper right corner of the map screen.
2. Check the box for “Borehole” to view the locations of borehole data, shown by solid red circles.
Query attributes of the borehole data and the display borehole logs
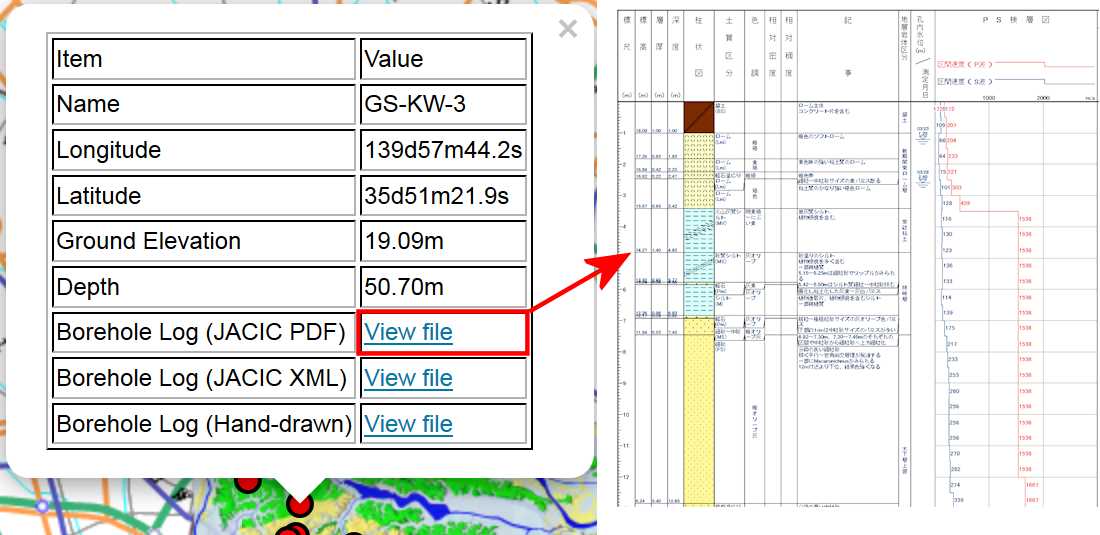
1. Click a borehole location (solid red circle).
2. Click the “View file” link on the attribute window to see the borehole logs.
Visualize 3D geological map
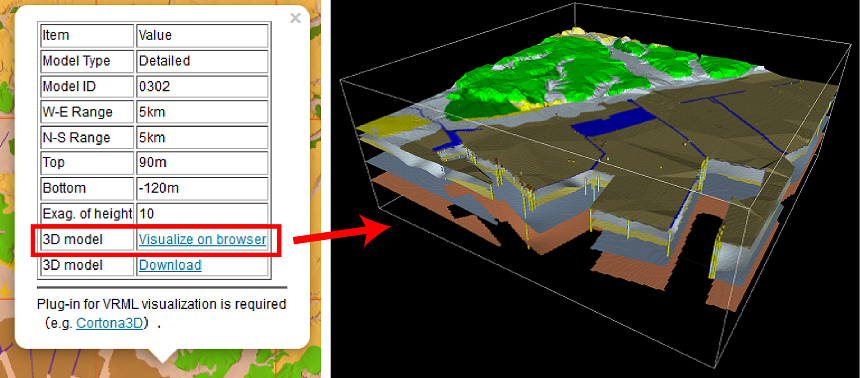
1. Click a cell (orange-colored rectangular) of objective area.
2. Click the “Visualize on browser” link on the attribute window.
Generate geological cross-section image
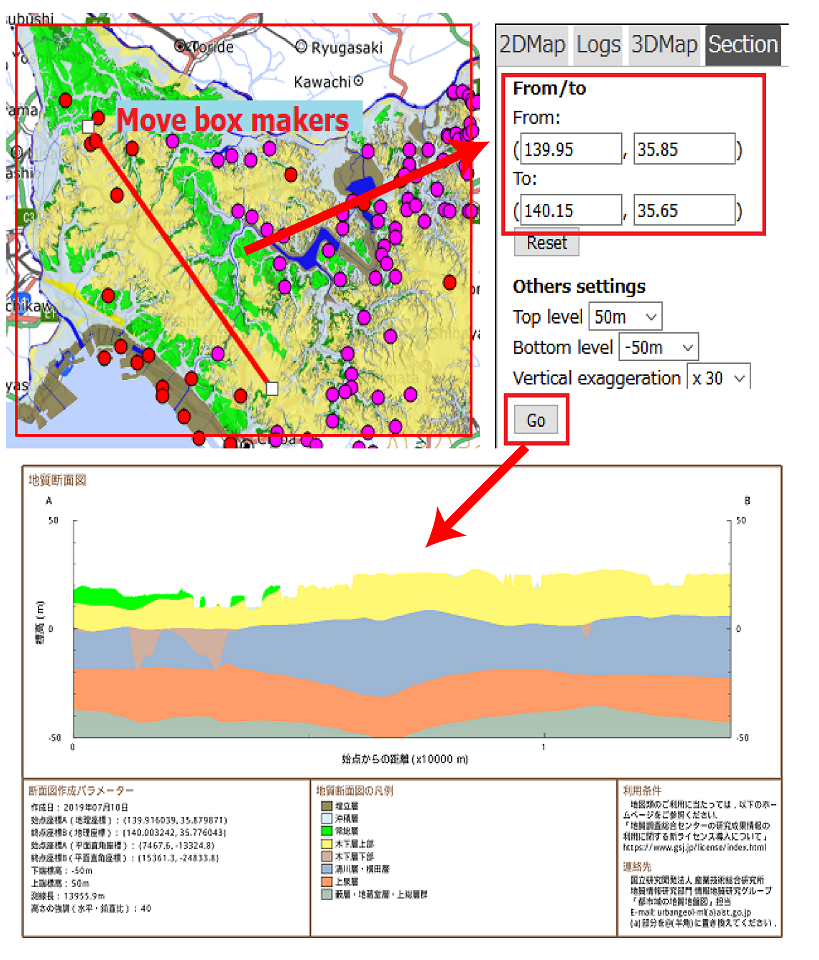
1. Set from/to points by moving the box marks on map window.
2. Choose the top/bottom level and vertical exaggeration from the pull-down menu.
3. Click “Go” button bellow.Click a borehole location (solid red circle).