


Image Database for Volcanoes
Time series satellite image of global volcanoes.
Introduction
Volcanoes create beautiful scenery and hot springs, and give us various metal resources. On the other hand, they give serious volcanic disasters. The 1815 Tambora Eruption killed about 92,000 people in Indonesia. Japan is a volcanic country, and many volcanic disasters occurred in Japan. The 1792 Unzen Eruption killed about 15,000 people by the landslide and tsunami caused by the eruption. Recently, Uzen Fugen-dake, Usu and Miyake-zima erupted and caused severe volcanic disasters. Many kinds of volcanic observations are conducted to mitigate a volcanic disaster. Remote sensing technique has made remarkable progress and plays an important part in the volcano observations.
We accumulated volcano images acquired by a satellite periodically in the Image Database for Volcanoes and display them as time series data to monitor the volcanic activity and mitigate a volcanic disaster. This database contains all ASTER images acquired at 964 volcanoes on the world and open them to the public. Newly acquired images will be added to the database as soon as possible.
How to retrieve a volcano
There are two ways to retrieve a volcano. "All volcanoes in alphabetic order" contains all 964 volcanoes in this database in alphabetic order. "All volcanoes with Google Earth", you can use Google Earth to retrieve the volcano you want from this database. You can retrieve same naumber of volcenoes both from "All volcanoes in alphabetic order (964 volcanoes)" and "All volcanoes with Google Earth". "All volcanoes with Google Earth" requires installing Google Earth.
Database update frequency
Newly acquired images will be added to the database as soon as possible. In general, new image will be available within a week after the ASTER observation, however, it may take more than a week. You can find the history of this database in the Update record.Statistics
You can find the statistics of this database in the Statistics. You can find the number of observation for each volcano and the corresponding volcano name on the Smithsonian Global Volcanism Program. All ASTER images that include a part of the 20 km by 20 km area centered on the geographic location of volcano are stored in the database, however, Number of observation includes the observation that observed at least the center of the 20 km by 20 km area.How to use the Image Database for Volcanoes
A new window will appear if you click on the All volcanoes in alphabetic order. You can select a volcano from All volcanoes with Google Earth. The ![]() icon indicates the location of a volcano with hotspot(s) in nighttime SWIR image and the
icon indicates the location of a volcano with hotspot(s) in nighttime SWIR image and the ![]() icon indicates the location of a volcano without hotspot in Google Earth.
icon indicates the location of a volcano without hotspot in Google Earth.
The Name of the volcano, thumbnail of the Best VNIR image, geographic location and elevation will be displayed. Click of the thumbnail of the Best VNIR image to view the most clear VNIR image ever observed. If you see the link to the Smithsonian Global Volcanism Program, you can obtain the eruption history by clicking on the link. If a Digital Elevation Model generated with ASTER has been registered, you can see the link to the Digital Elevation Model generated with ASTER. A page of detailed elevation data will appear when you click the link. You can find the way to see the digital elevation page in the next section.
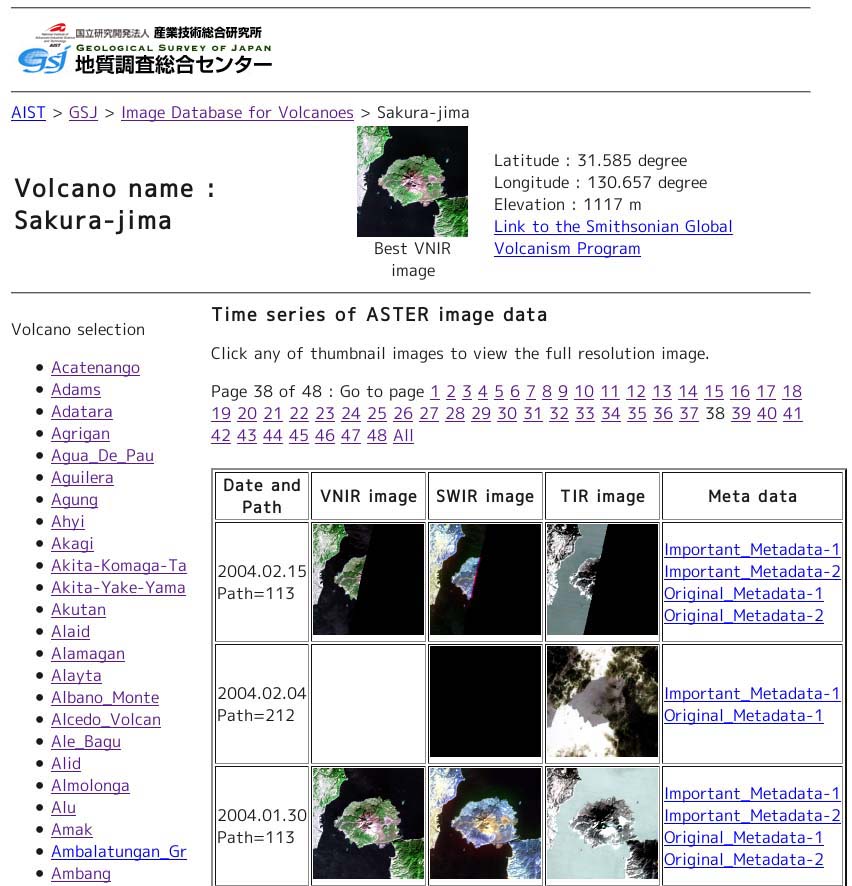
You can see a page that displays 10 ASTER images in descending order when you click a page number. The smaller page number includes newer images. A page that displays all ASTER image will appear when you click "All".
You can see the Time series of ASTER image data that represents the 20 km by 20 km centered on the volcano. One row of the table represents one observation. The Observation date is seen in the far left column of the row in the YYYY.MM.DD format. The following three digits indicate the orbit number of the satellite. The orbit number is a number from 1 to 233 that represents one orbit around the Earth by the satellite. The satellite travels around the Earth 14.5 times per day and returns to the same orbit every 16 days. You may found "Hot spot(s) in SWIR" in the far left column. It means that thermal anomaly(s) was detected during the nighttime SWIR observation. Most of the thermal anomaly is related to the volcanic activity, however, some of them are caused by wildfire of human activity. If you want to know the observation time, click Important_Metadata-1 at the far right column of the row. A new window will appear and you can find the date and time (UT) of the observation at Date and time. Each of the images represents the 20 km by 20 km centered on the volcano. The map projection of the image is UTM. You can find the UTM Zone number of the UTM Zone by clicking the Important_Metadata-1. You can find the latitude and longitude at the upper-left corner of the image on the same window. All ASTER images are orthorectified with GDEM in this web site. It results a difference between the ASTER image and topographic map. Click any of the thumbnail images to view the full resolution image. The image size of the full resolution image is not the same because the ground resolution is dependent on the sensor.
In the VNIR image, ASTER bands 1, 2 and 3 are used. ASTER does not have a blue band, the color of VNIR image is different from the true color. Volcanic plume and discolored sea area caused by submarine volcanism can be detected using a VNIR image. Automatic brightness correction is applied to the image, but the brightness correction may not be adequate when the image includes no data areas or clouds. The original ground resolution is 15 m per pixel.
In the SWIR image, ASTER bands 9, 5 and 4 are assigned to red, green and blue, respectively. Bright spots in the night image may be hot spots of the volcano. Automatic brightness correction is applied to the image, and stripe noise is shown in the night image. The original ground resolution is 30 m per pixel.
In the TIR image, ASTER bands 11, 13 and 14 are assigned to red, green and blue, respectively. Bright areas represent warm areas, and dark areas represent cold areas. The summit area looks dark because the surface temperature decreases with elevation. You may find a hot spot in hot area caused by volcanic activity. Volcanic plume looks cyan when the plume contains sulfur dioxide gas because sulfur dioxide absorbs infrared radiation at the wavelength corresponding to band 11. Automatic brightness correction is applied to the image, and stripe noise may be shown in the ocean that has uniform surface temperature. The original ground resolution is 90 m per pixel.
A summary of the meta data will be shown when you click Important_Metadata-1 at Meta data column. You can see all the meta data by clicking Original_Metadata-1. More than one meta data will be listed in the Meta data column when the volcano is covered by two continuous scenes.
The combination of VNIR, SWIR and TIR images are dependent on the observation modes.
- In the ordinary daytime observation, all the VNIR, SWIR and TIR images are listed.
- The SWIR and TIR or TIR mode observation is conducted in the nighttime
- The VNIR mode is used in an emergency observation.
How to see the Digital Elevation Model
If the Digital Elevation Model is registered for the volcano, you can see the link to the Digital Elevation Model generated with ASTER. You can retrieve the Digital Elevation Model page by clicking the link.
The Observation date is seen in the far left column of the row in the YYYY.MM.DD format. The DEM image is a shaded relief image of the elevation calculated from ASTER band 3 and 3b. The elevation is the height from the WGS84 surface, it does not consider the geoid. Automatic brightness correction is applied to the image. The original ground resolution is 30 m per pixel. Click the thumbnail image to view the full resolution image.
A summary of the meta data will be shown when you click the text in the Meta data column. More than one meta data set will be listed in the Meta data column when the volcano is covered by two continuous scenes.
Intellectual property rights
The Image Database for Volcanoes is proved under a CC BY 4.0 Intl. Please refer to the GSJ license pages in use. However, there are no restrictions on ASTER data downloaded from Image Database for Volcanoes, and it can be used or redistributed as desired. A statement of the data source when citing, copying, or reprinting ASTER data or images is recommended. imagery courtesy "NASA/METI/AIST/Japan Spacesystems, and U.S./Japan ASTER Science Team, ASTER"
If you have any questions, please send an e-mail to  .
.
A part of data processing for the database is done by MADAS. We thank MADAS for their support.
If you would like to know more about ASTER, visit ASTER Science Project.