 AIST
GSJ
GEO-DB
GALILEO Top
AIST
GSJ
GEO-DB
GALILEO Top
Gravity Map Series 27
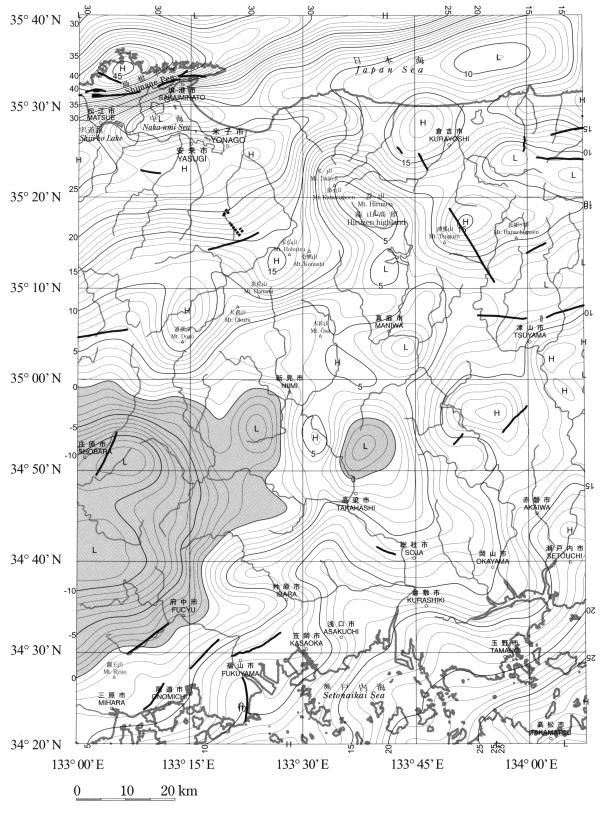
Gravity map of Okayama district (Bouguer anomalies) 1:200,000

Gravity Map of Okayama District (Bouguer Anomalies)
A new gravity map of Okayama district has been published.
Compiled gravity data within the map area are 13,860 stations including newly added 1,136 gravity stations on land.
All the measured gravity data were referred to the Japan Gravity Standardization Net 1975 (JGSN75) and
normal gravity values were calculated according to the Geodetic Reference system 1980 (GRS80).
Bouguer, terrain and other corrections were applied,
following the standard procedure of gravity data processing at the Geological Survey of Japan,
AIST (SPECG 1988)(GSJ Gravity Survey Group,1989).
The Bouguer and terrain corrections were carried out to remove an effect of bounded spherical crust and an effect of actual topographic undulation relative to the spherical surface,
respectively, within a distance range of 60 km. The density value used for both Bouguer and terrain corrections is 2.3 g/cm3 (shown on the map as assumed density).
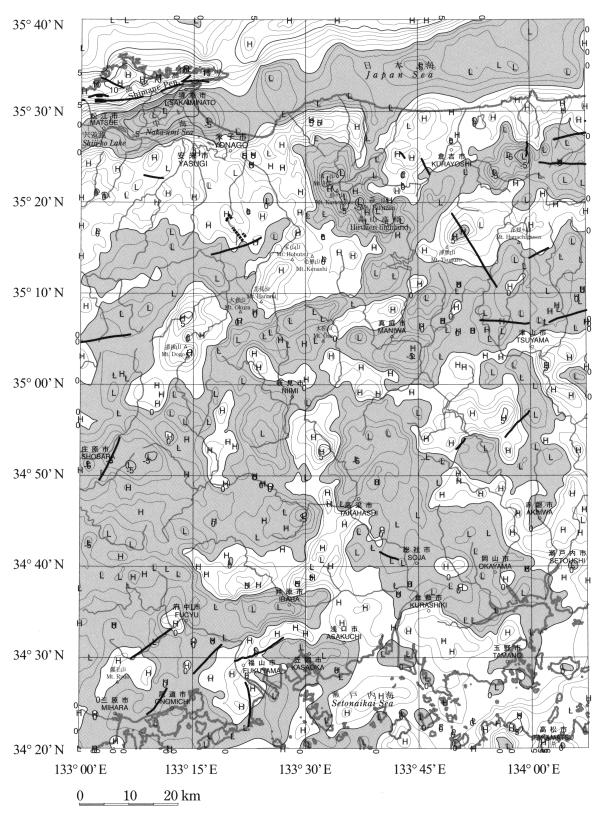
Bouguer anomaly maps which have been corrected by densities of 2.00 g/cm3 and 2.67 g/cm3 are shown in Fig. 1 and Fig. 2, respectively.
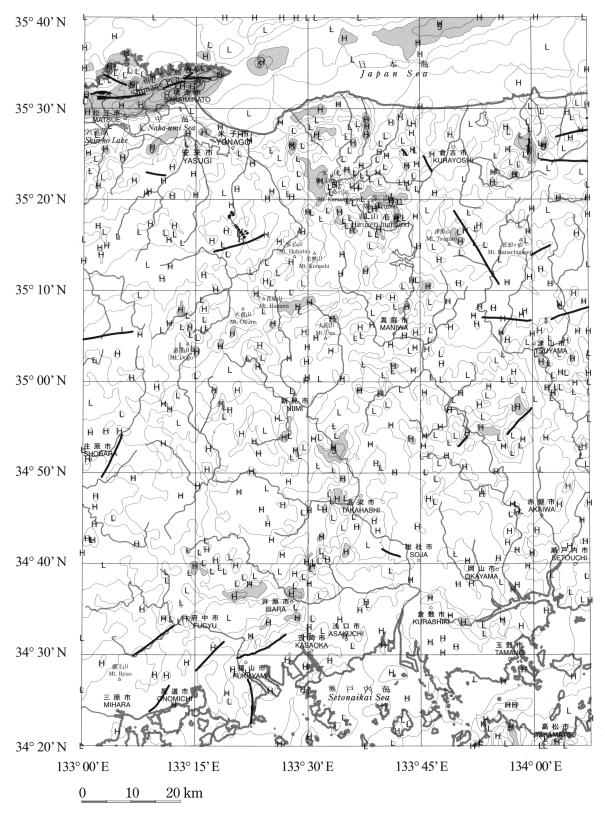
Three additional maps, i.e. regional Bouguer anomalies continued upward 2 km (Fig. 3),gravity residual anomalies with the removal of the 2 km upward-continuation (Fig. 4) and horizontal derivation (Fig. 5) are also produced to enhance the features described in the following.
The Bouguer anomaly maps and filtered gravity maps revealed following features:
(1) This area is mainly covered by gentle slope positive Bouguer anomalies.
(2) Short-wavelength and high Bouguer anomalies are very good match with Paleozoic rocks such as Permian Maizuru group.
(3) Steep gravity change over 45 mGal exists between the Shimane peninsula and the Shinji-ko lake and Naka-umi sea.
(4) Low gravity anomaly about 5-10 mGal corresponds to the Daisen volcano and Hiruzen volcano.
(5) Gravity changes along and/or across active faults or the earthquake fault of the 2000 Tottoriken-Seibu earthquake are not clearly defined.