 AIST
GSJ
GEO-DB
GALILEO Top
AIST
GSJ
GEO-DB
GALILEO Top
Gravity Map Series 26
Gravity map of Matsuyama district (Bouguer anomalies) 1:200,000
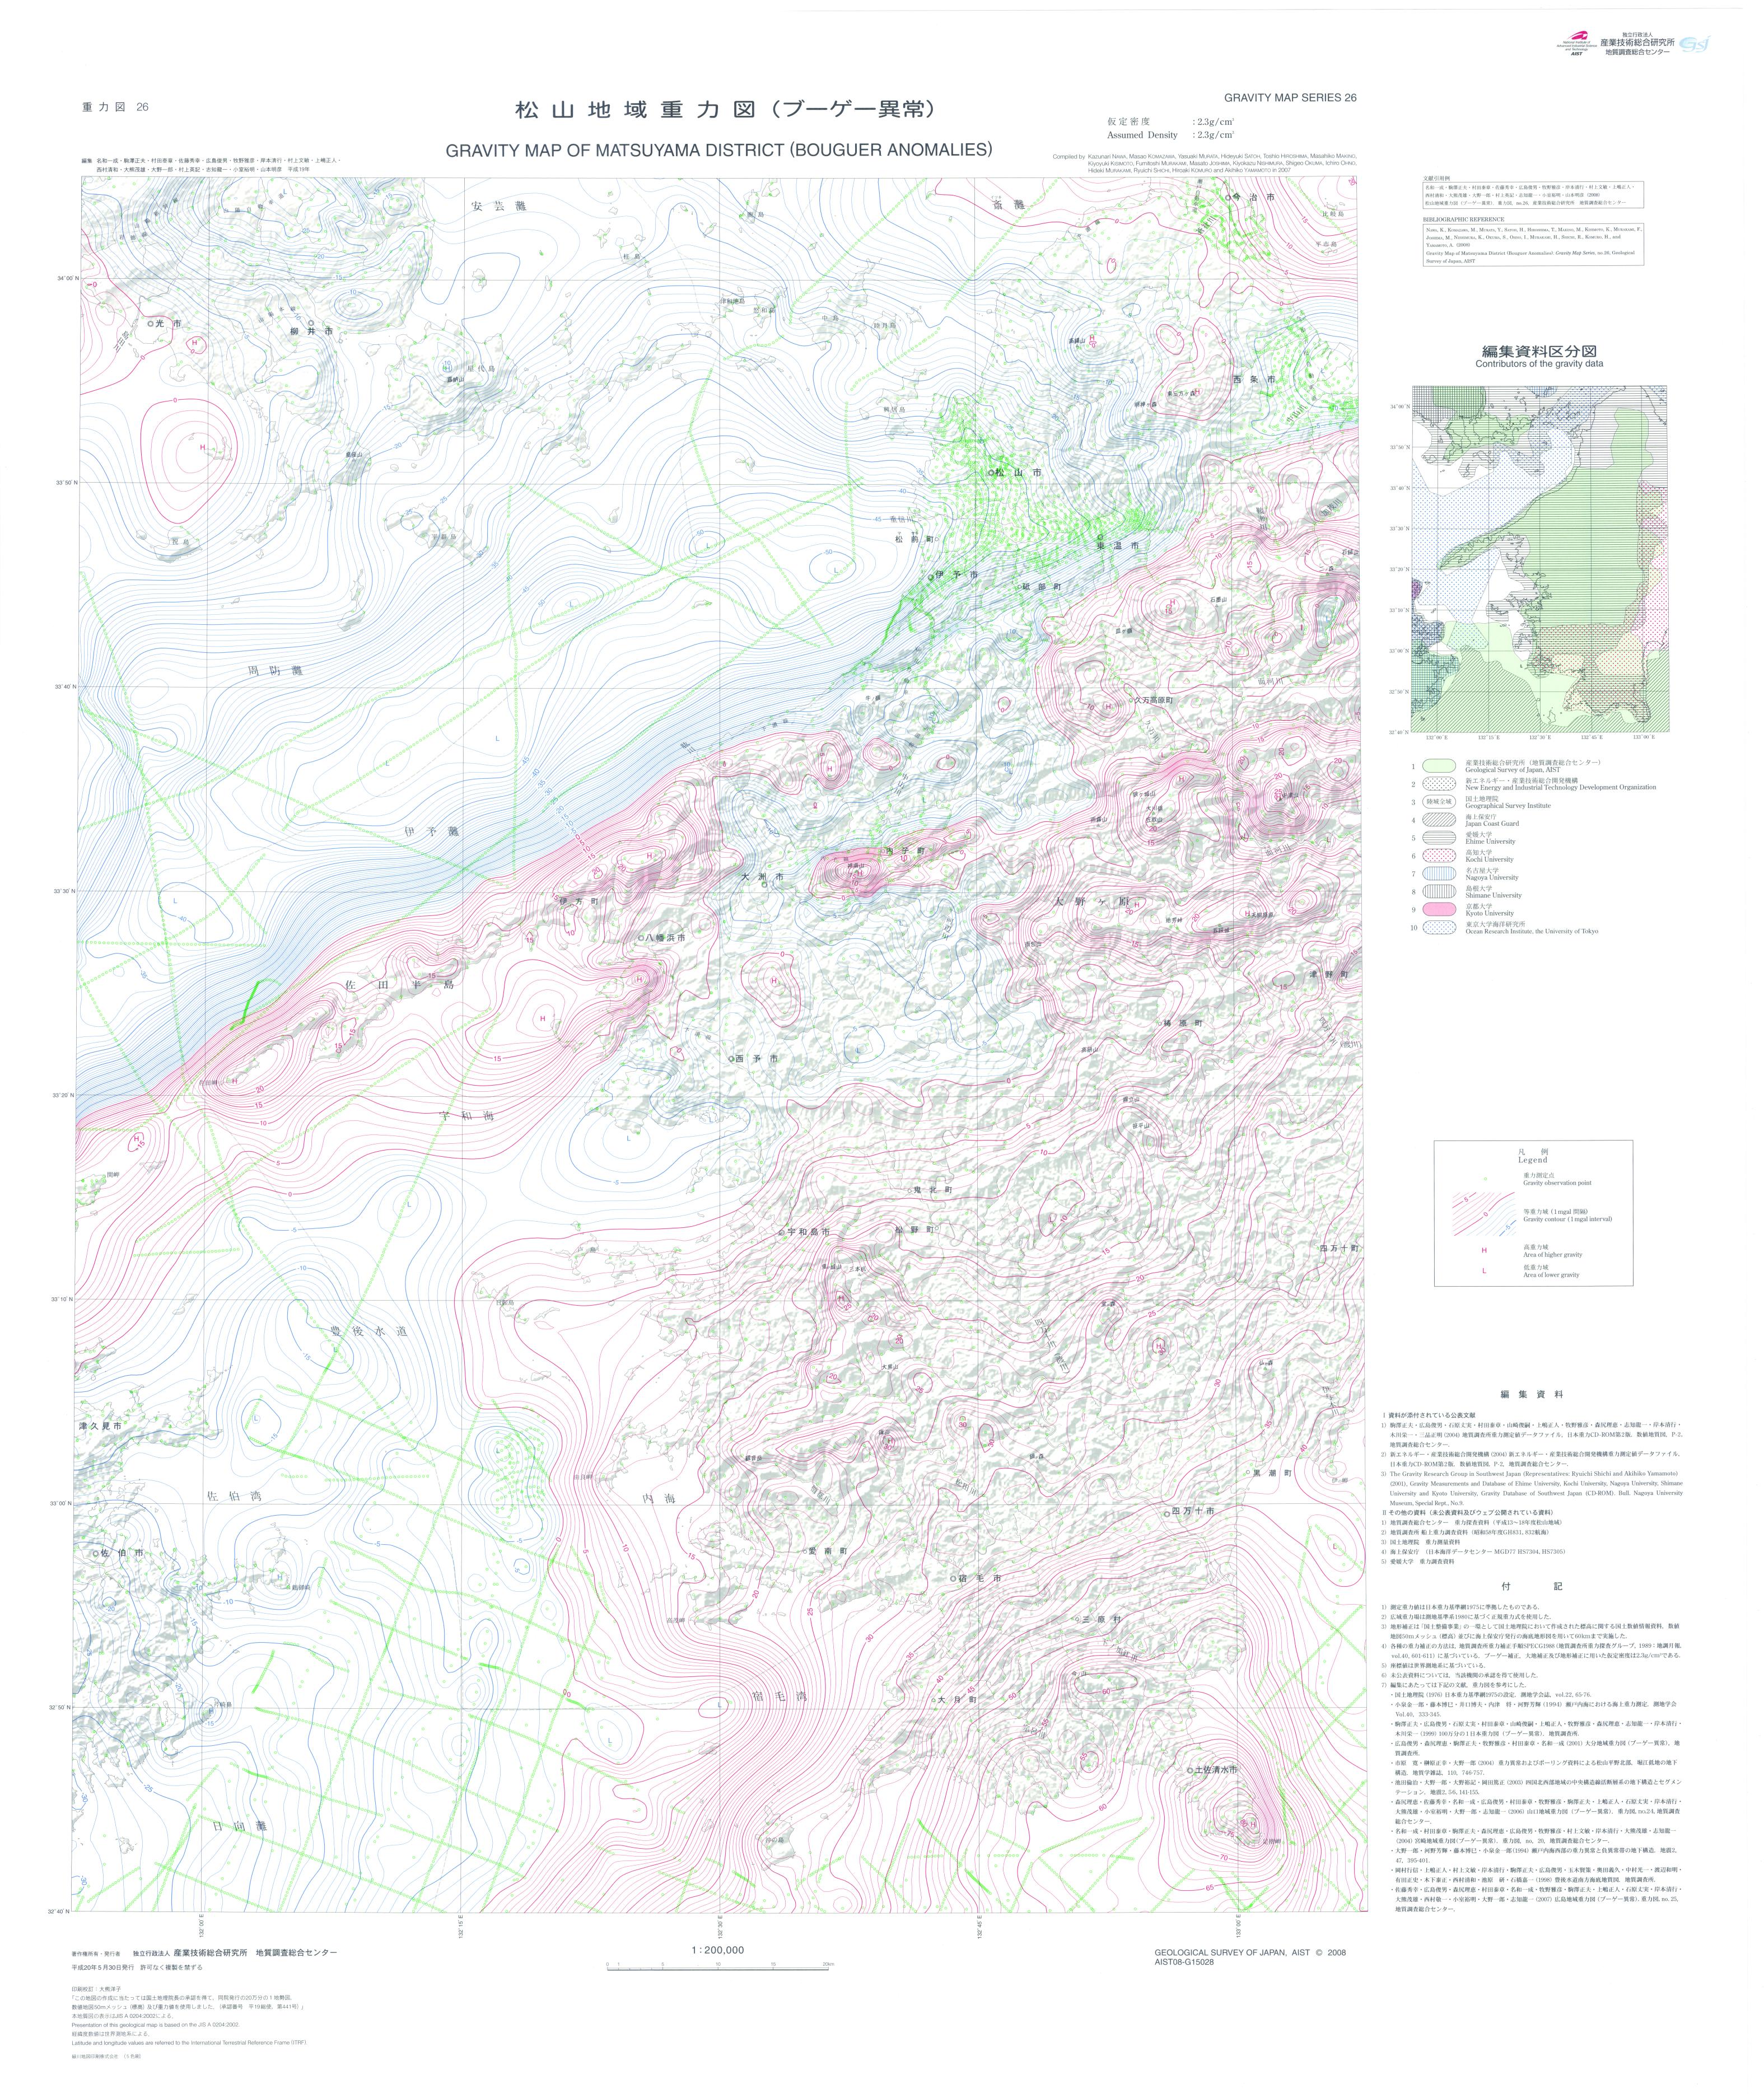
Gravity Map of Matsuyama District (Bouguer Anomalies)
A new 1:200,000 gravity map of Matsuyama district has been published.
Compiled gravity data within the map area were 17,605 stations including new 506 gravity stations on land, mainly in mountains area.
All measured gravity data were referred to the Japan Gravity Standardization Net 1975 (JGSN75) and normal gravity values were calculated
according to the Geodetic Reference system 1980 (GRS80).
Bouguer, terrain and other corrections were made by the standard procedure of gravity data processing at the Geological Survey of Japan (SPECG1988).
The Bouguer and terrain corrections were carried out as an effect of bounded spherical crust and actual topographic undulation relative to the spherical surface,
respectively, within the distance range of 60 km. The density for both Bouguer and terrain corrections is taken to be 2.3 g/cm3 (shown on map side).
Maximum and minimum values of the Bouguer anomaly map are approximately 80 mgal near the Ashizuri Cape and -50 mgal near Iyo-nada in the Seto inland sea,respectively.
The Bouguer anomaly map shows clear correlation with a geological structure pattern in general. Long-wavelength patterns of gravity anomalies are coincident with distributions of the geological belts:
The Ryoke belt (the northwestern part of this area) roughly shows negative anomalies. The Sanbagawa and the Chichibu belts (the middle area) show a mix of negative and positive anomalies.
The Shimanto belt (the southeastern area) shows positive anomalies.
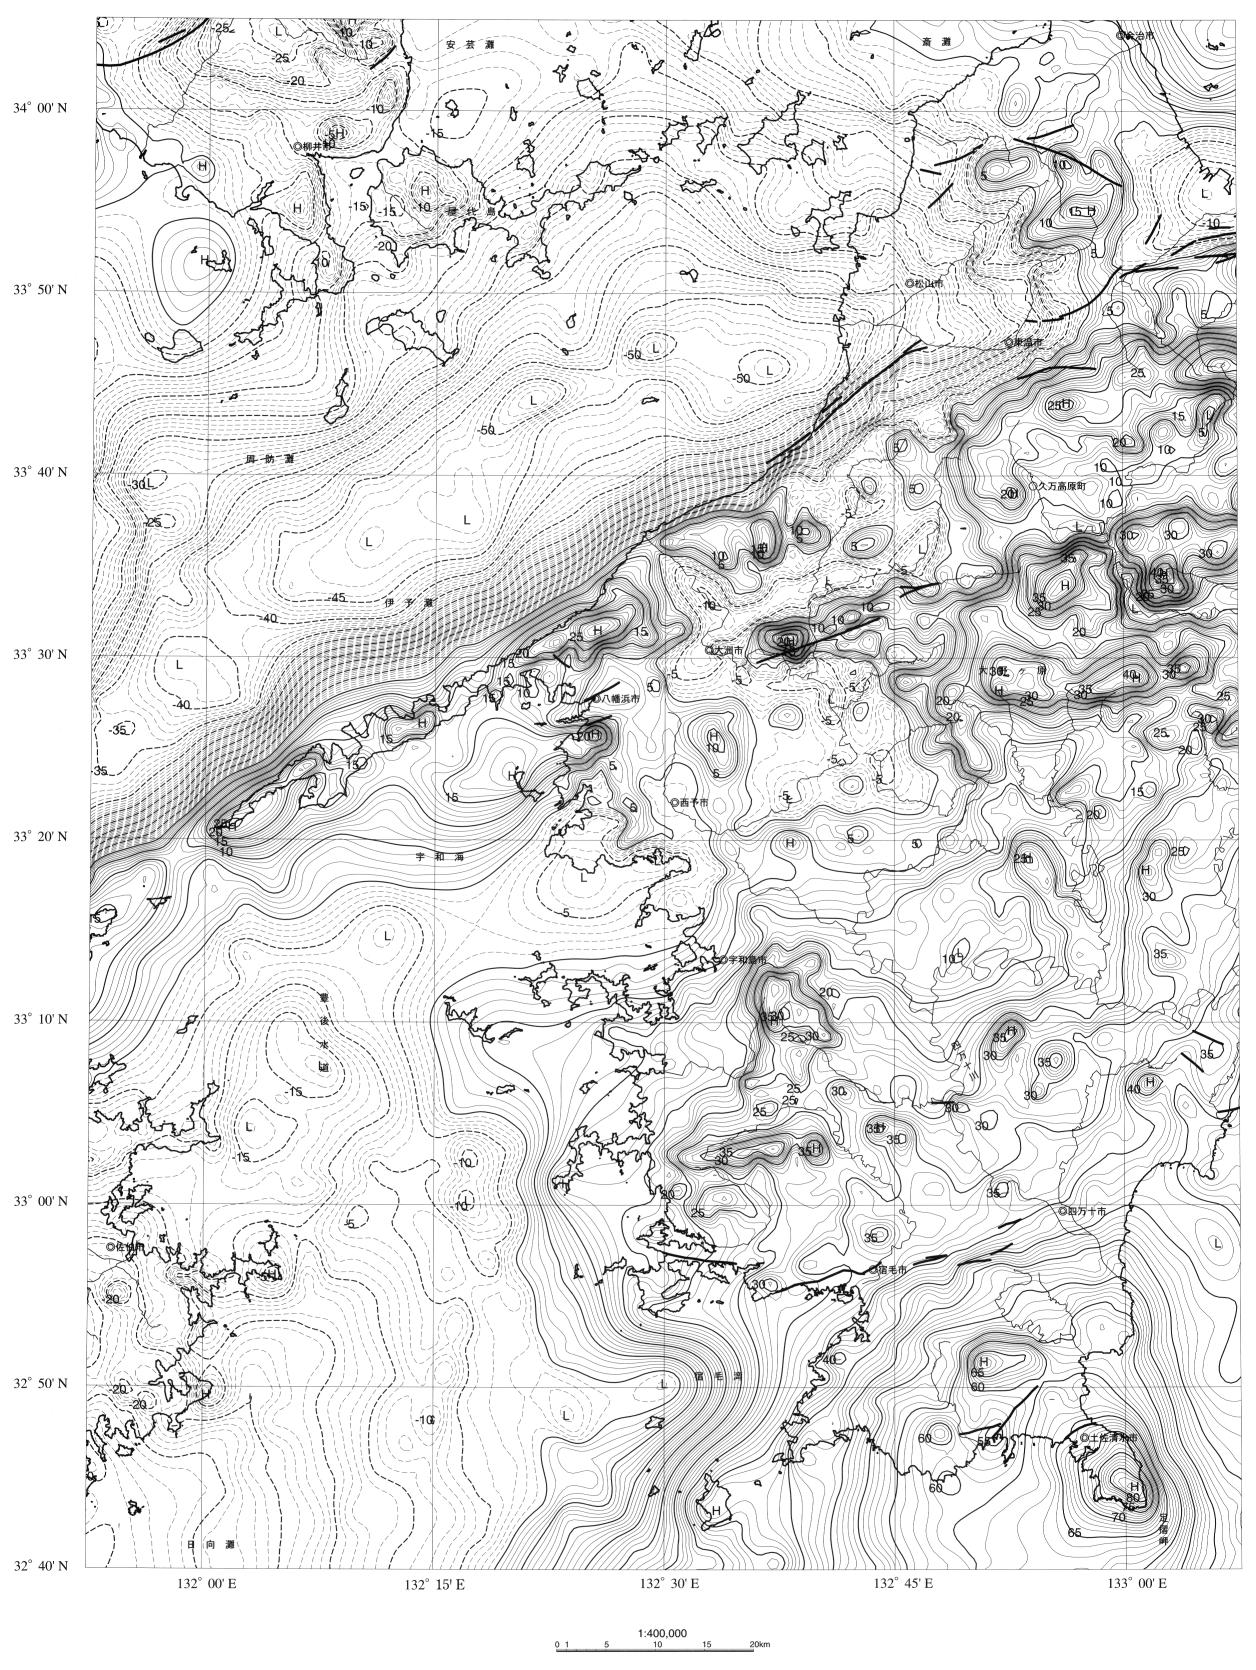
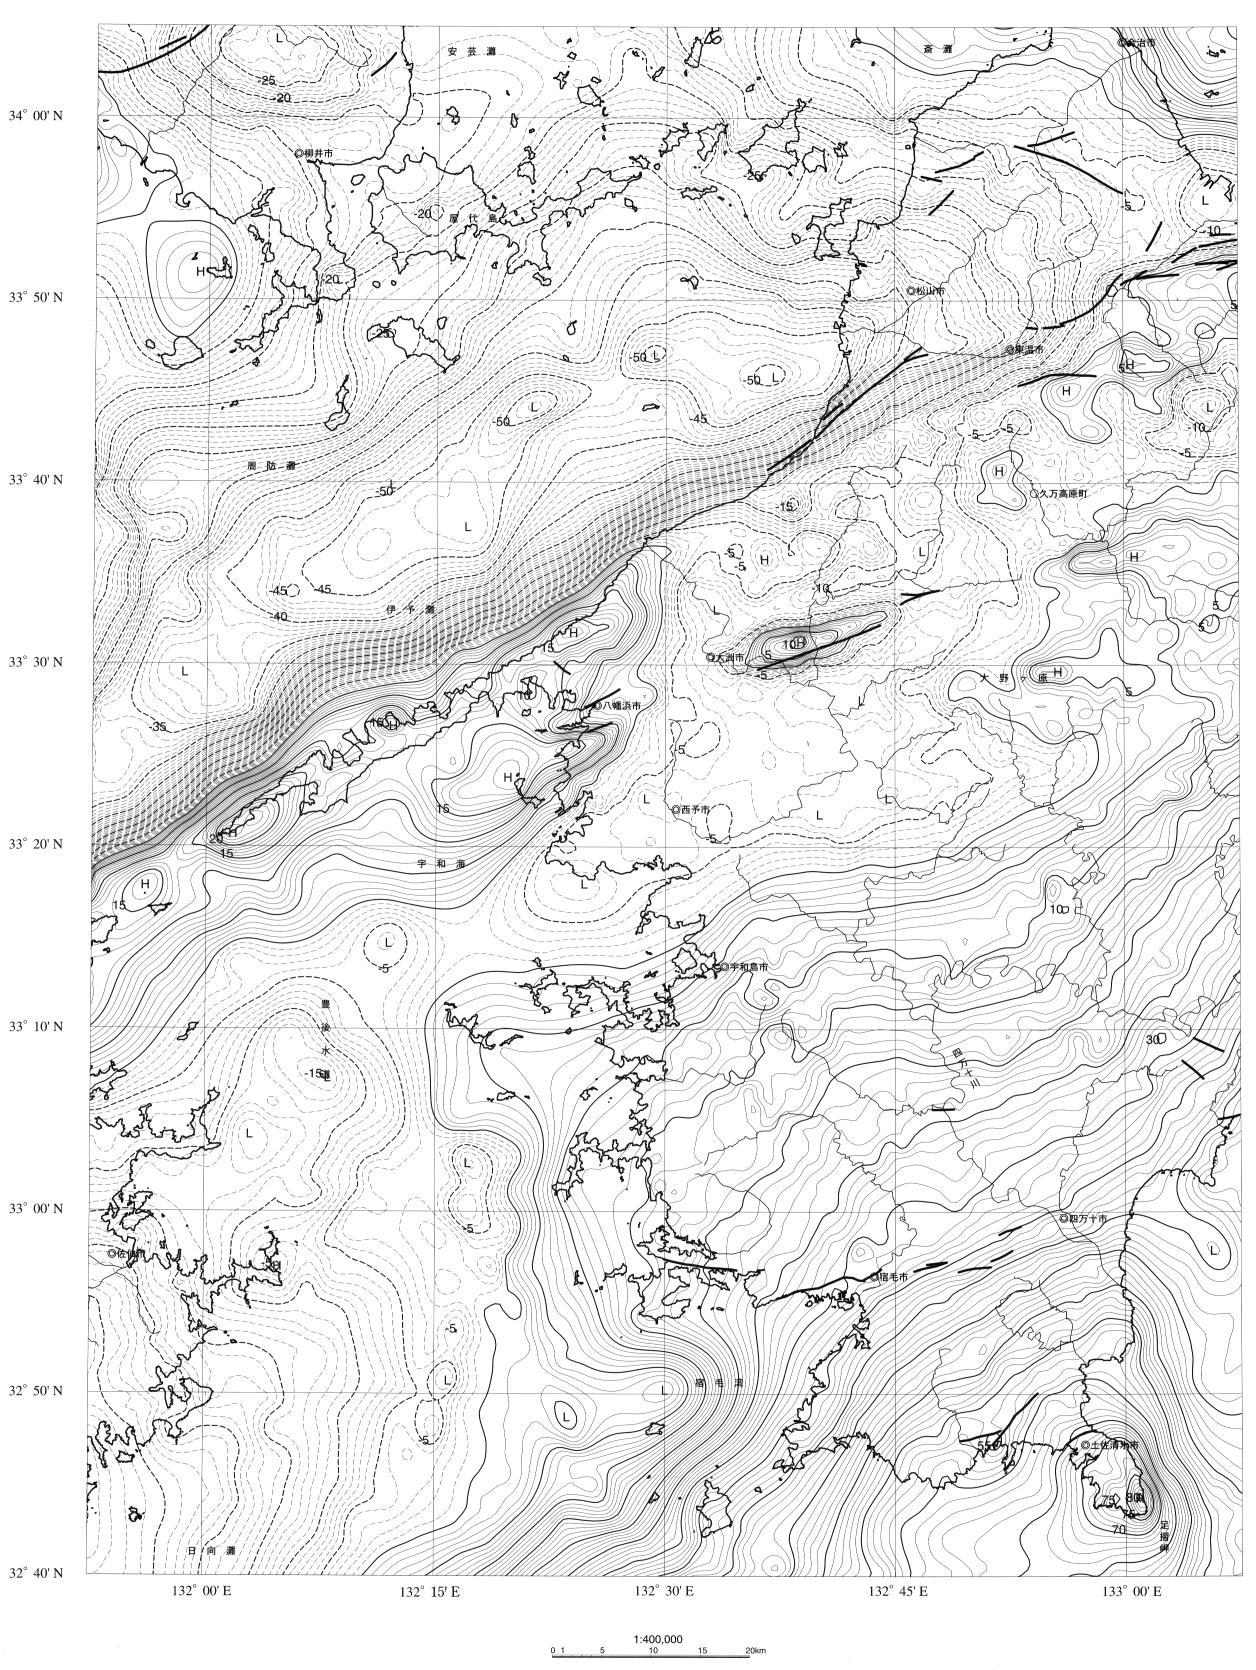
It is noted that short-wavelength high anomalies correspond to areas of the Mikabu greenstone complex and gabbro near the Ashizuri Cape. We show gravity maps with assumed densities of 2.0 g/cm3 (Fig.1) and 2.67 g/cm3 (Fig.2).
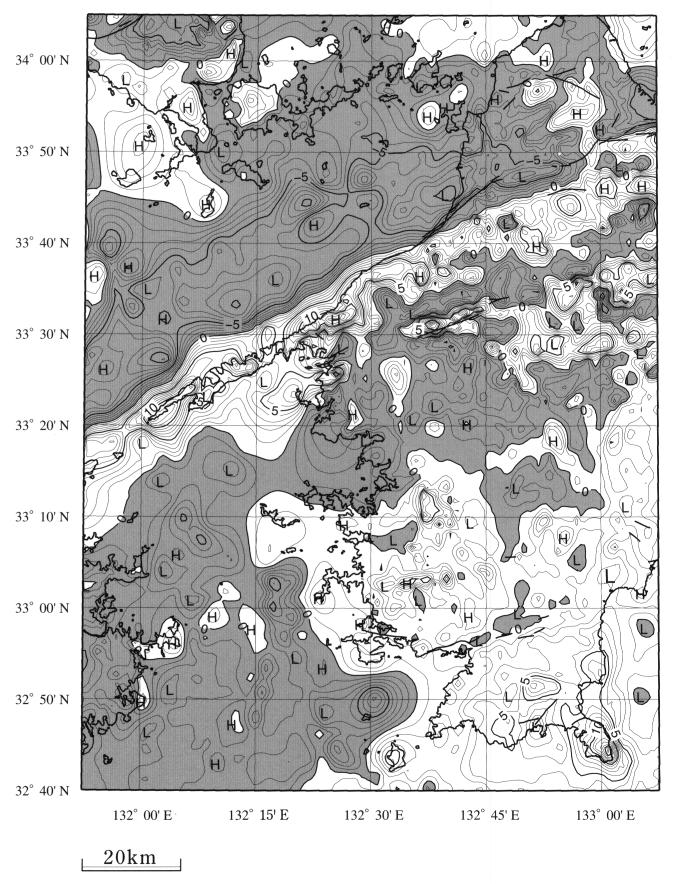
Regional Bouguer anomalies continued upward 2 km (Fig.3), gravity residual anomalies with the removal of the 2 km upward-continuation (Fig.4) and horizontal derivation (Fig.5) maps are also shown in this description side.
The Bouguer anomalies caused by local geological feature are emphasized on the residual map.
The horizontal derivation map clearly shows structural boundaries like active faults as the Median Tectonic Line between the Ryoke belt and the Sanbagawa belt.