 AIST
GSJ
GEO-DB
GALILEO Top
AIST
GSJ
GEO-DB
GALILEO Top
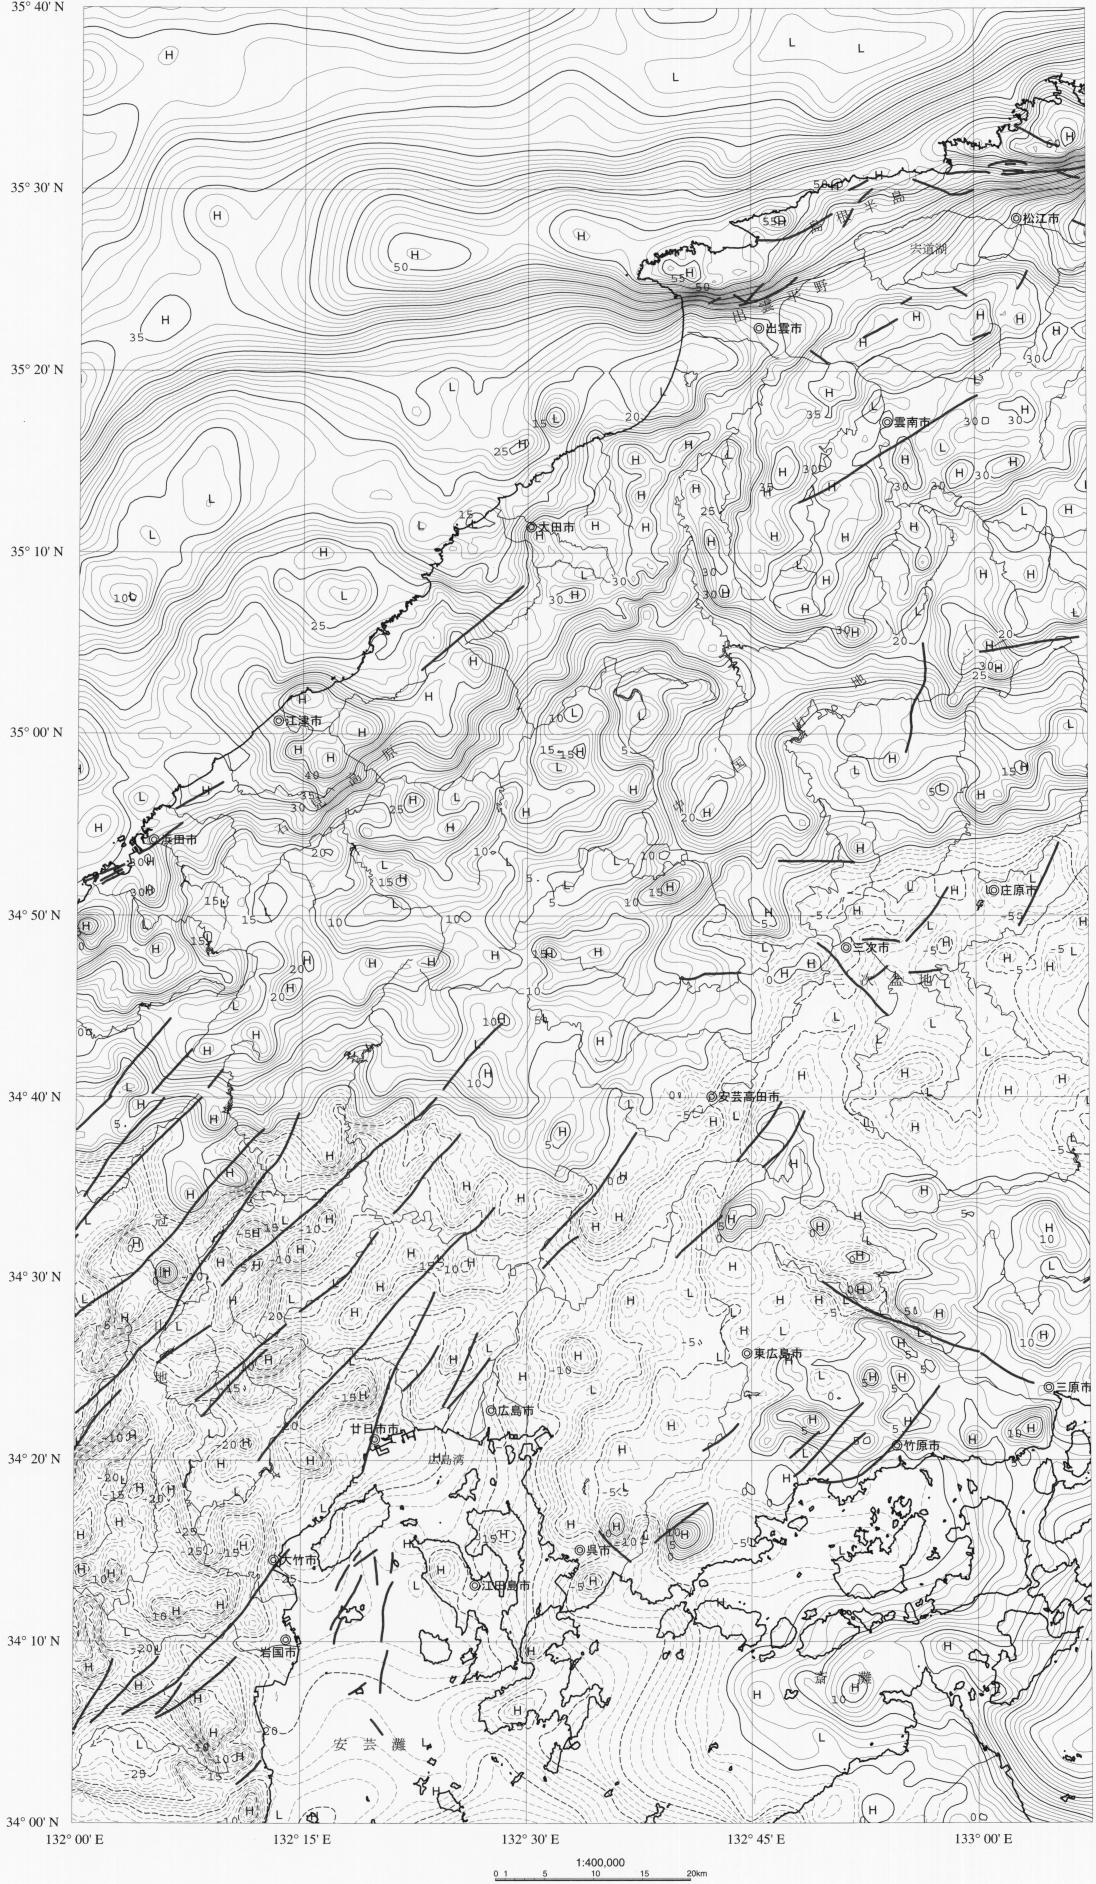
Gravity Map Series 25
Gravity map of Hiroshima district (Bouguer anomalies) 1:200,000
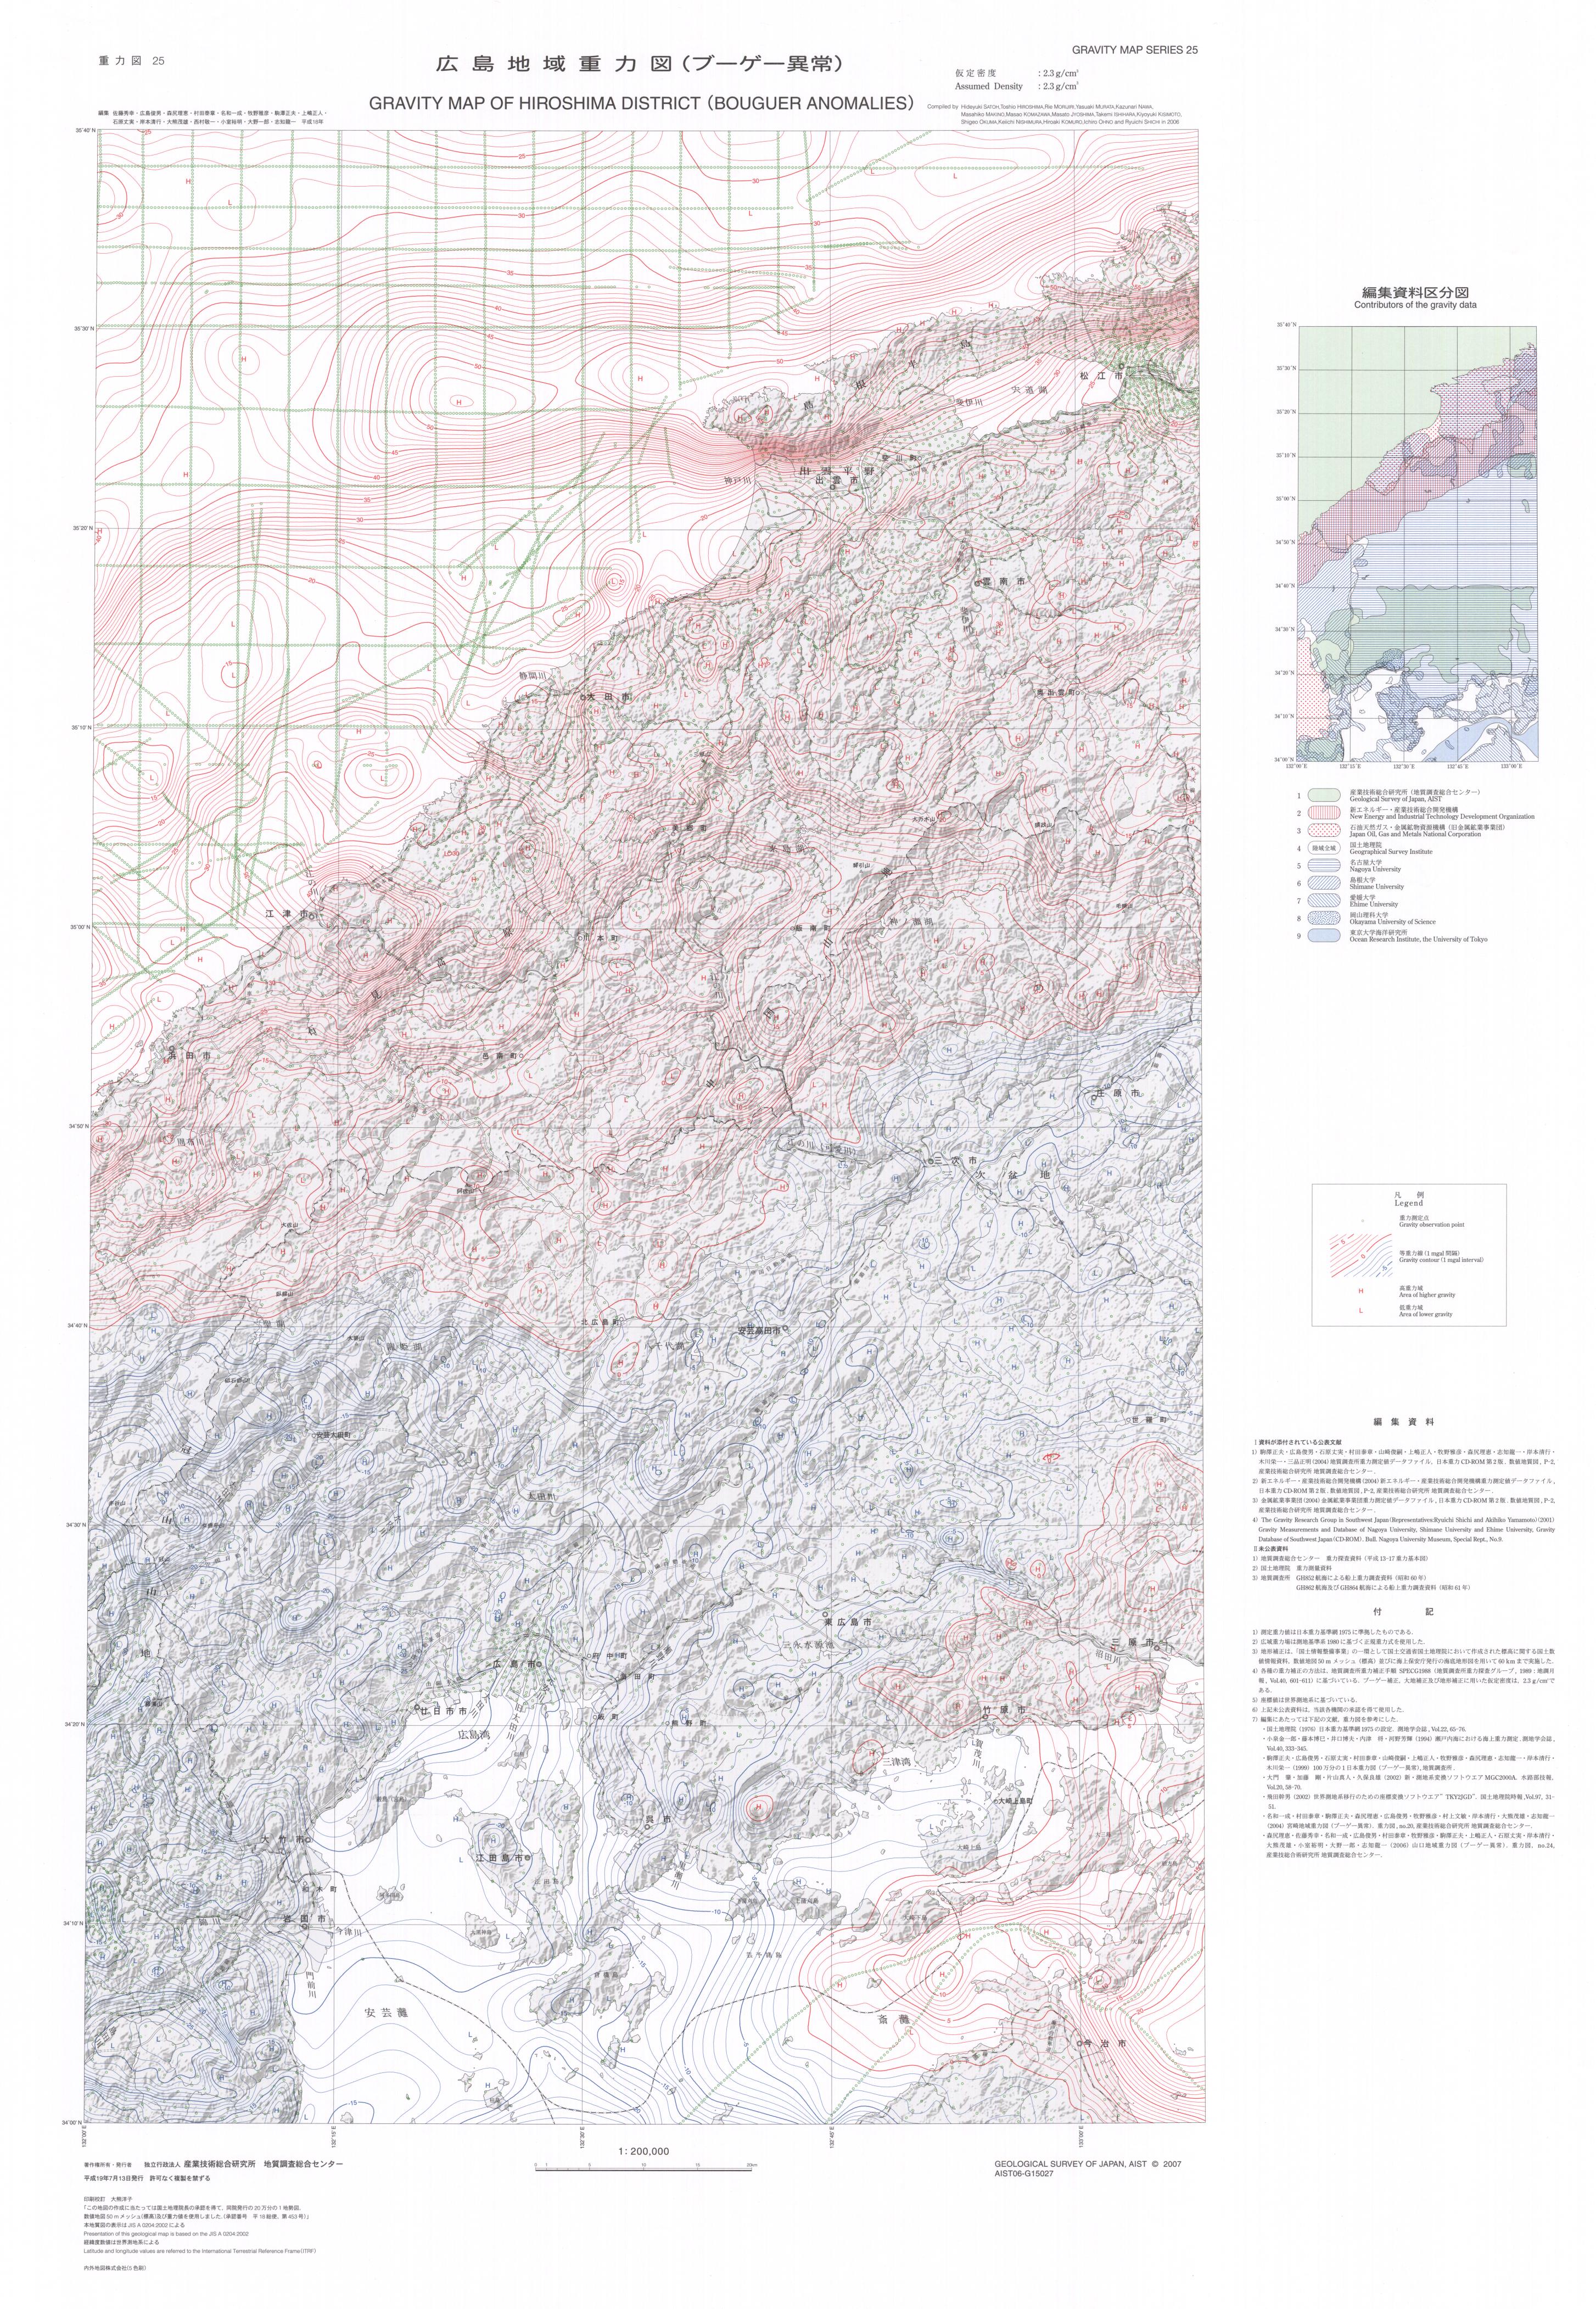
Gravity Map of Hiroshima District (Bouguer Anomalies)
A new gravity map of Hiroshima district has been published.
Compiled gravity data within the map area were 14,756 stations including new gravity stations on land.
All measured gravity data were referred to the Japan Gravity Standardization Net 1975 (JGSN75) and normal
gravity values were calculated according to the Geodetic Reference System 1980 (GRS80). Bouguer,
terrain and other corrections were made by the standard procedure of gravity data processing at the Geological Survey of Japan (SPECG1988).
The Bouguer and terrain corrections were carried out as an effect of bounded spherical crust and actual topographic undulation relative to the spherical surface, respectively,
within the same distance range of 60 km. The density for both Bouguer and terrain corrections is taken to be 2.3g/cm3.
The Bouguer anomaly map revealed the following main features:(1) A broad gravity anomaly is distributed in the central to the southwestern part of the study area.
Comparing with a geological map (Yamada et al.,1986), the distribution of this anomaly is consistent with that of the Takada rhyolites and Hiroshima granitic rocks in the late Cretaceous.
(2) A steep gravity gradient between positive and negative gravity anomalies is situated in the northern edge of the Izumo plain extending toward the Sea of Japan.
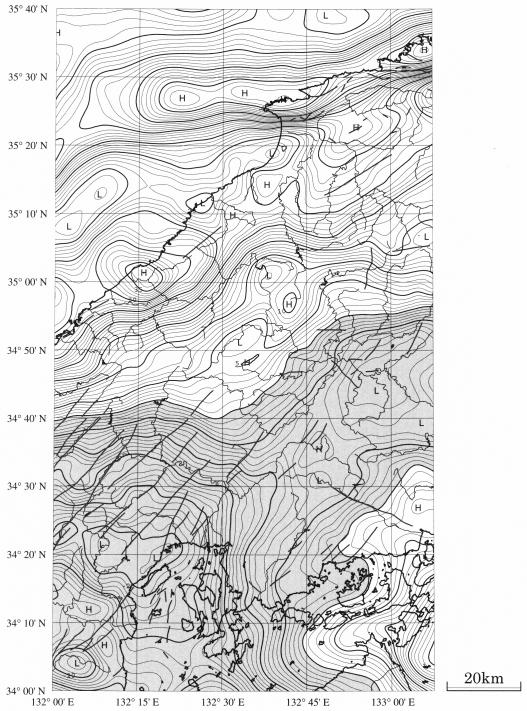
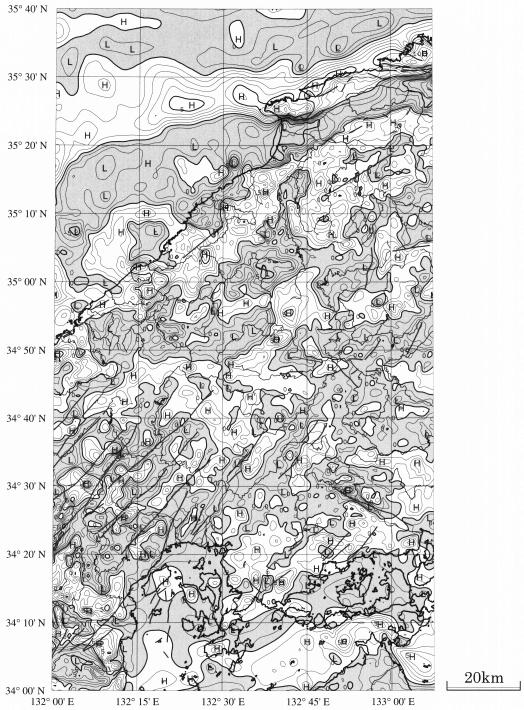
This gravity gradient may be caused by the shallow and local geological structure. We show gravity maps with assumed densities of 2.0g/cm3(Fig.1) and 2.67g/cm3(Fig.2), respectively.
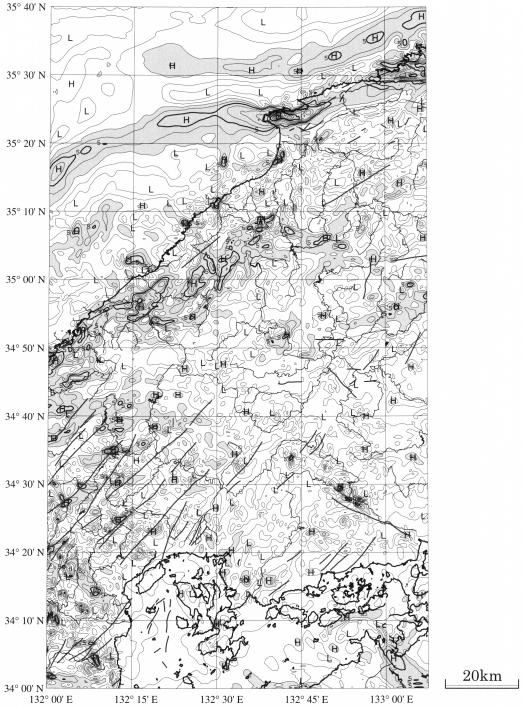
Regional Bouguer anomalies(Fig.3), gravity residual anomalies with the removal of the 2 km upward-continuation (Fig.4) and horizontal derivation(Fig.5) maps were also shown in this side.
The Bouguer anomalies caused by local geological feature are clearer on the residual map. The horizontal derivation map clearly shows structural boundaries.