 AIST
GSJ
GEO-DB
GALILEO Top
AIST
GSJ
GEO-DB
GALILEO Top
Gravity Map Series 24
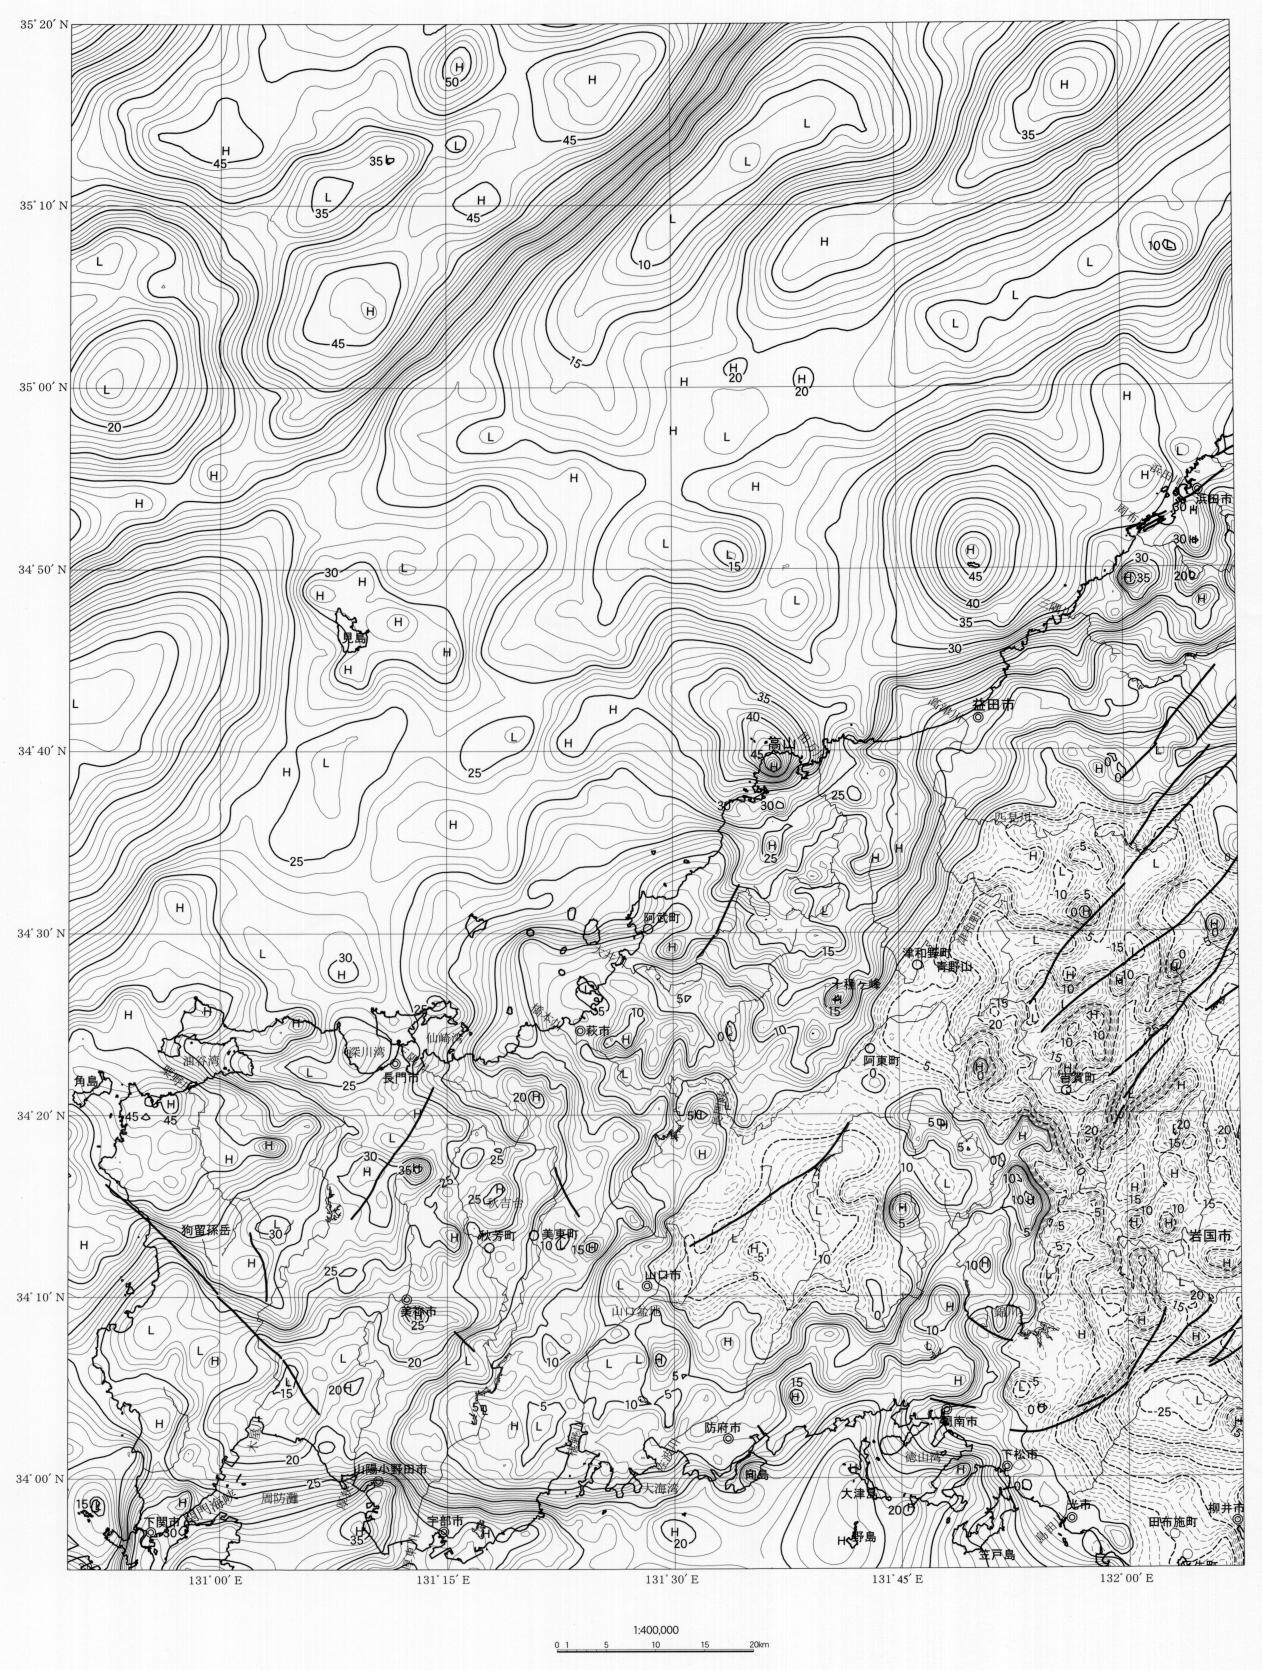
Gravity map of Yamaguchi district (Bouguer anomalies) 1:200,000
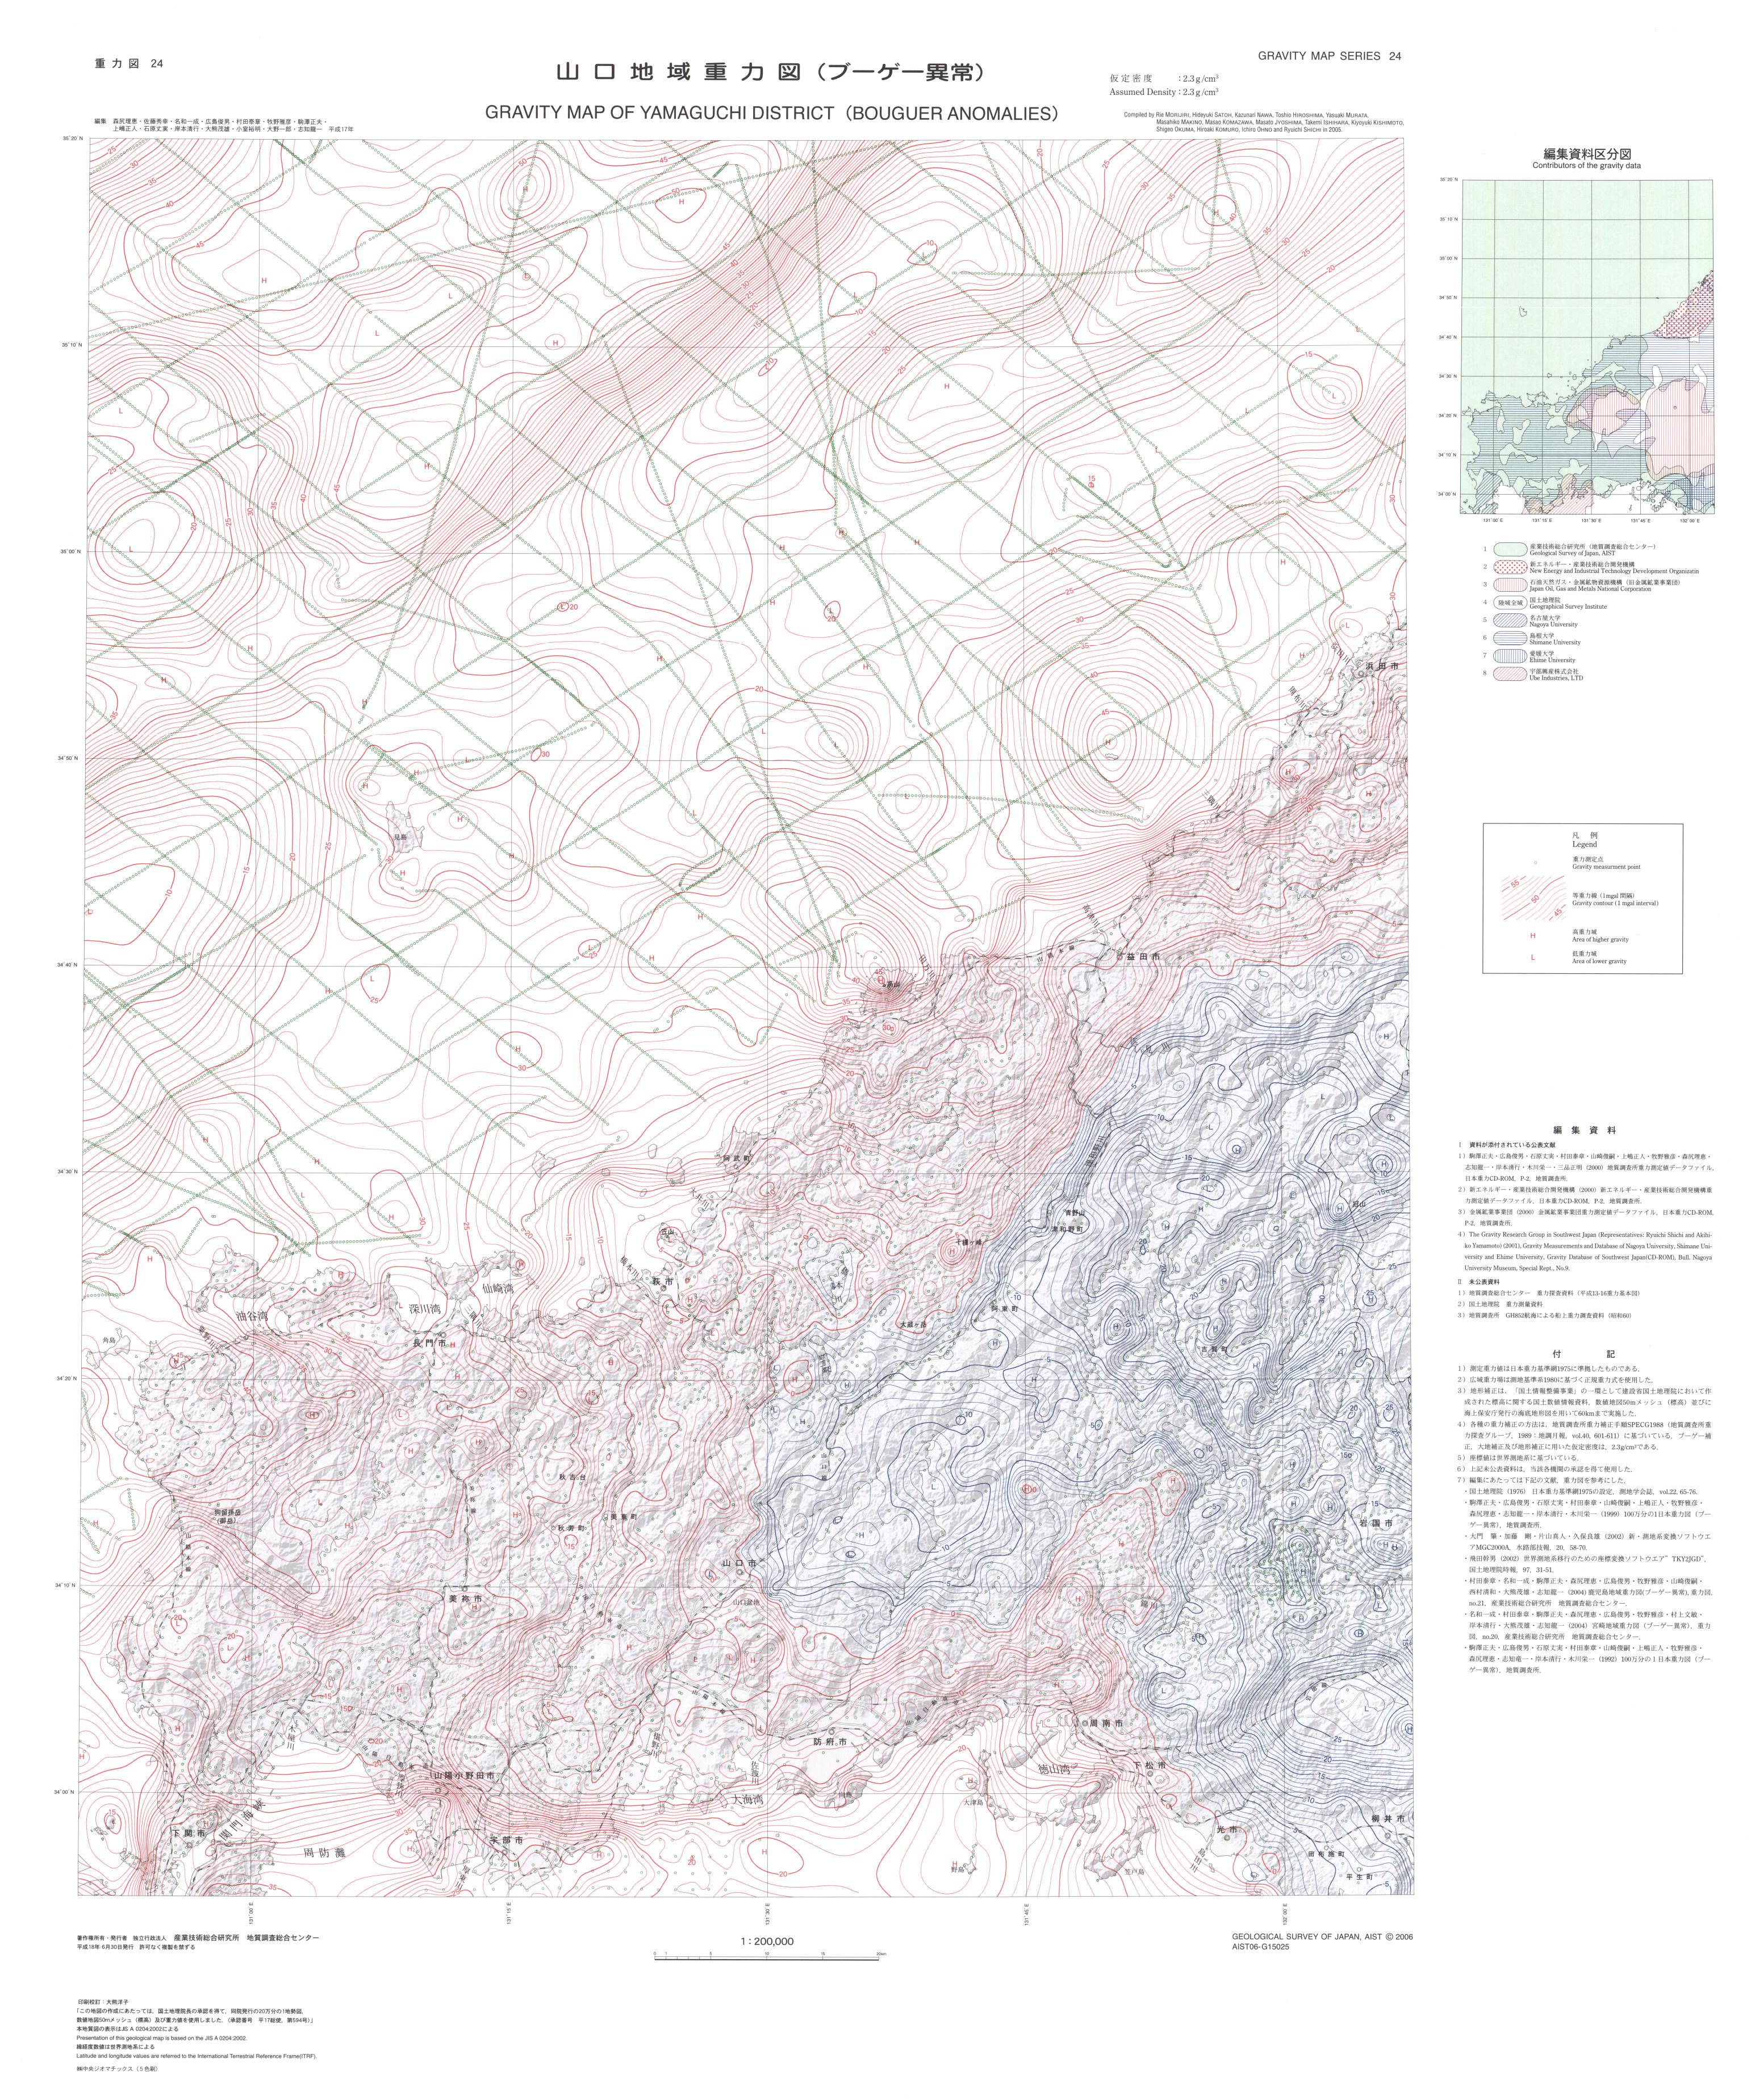
Gravity Map of Yamaguchi District (Bouguer Anomalies)
A new gravity map of Yamaguchi district has been published.
Compiled gravity data within the map area were 16,274 stations including 844 new gravity stations on land.
All measured gravitydata were referred to the Japan Gravity Standardization Net 1975 (JGSN75) and normal gravity values were calculated according to the Geodetic Reference System 1980 (GRS80). Bouguer,
terrain and other corrections were made by the standard procedure of gravity data processing at the Geological Survey of Japan (SPECG1988).
The Bouguer and terrain corrections were carried out as an effect of bounded spherical crust and actual to-pographic undulation relative to the spherical surface, respec-tively, within the same distance range of 60km.
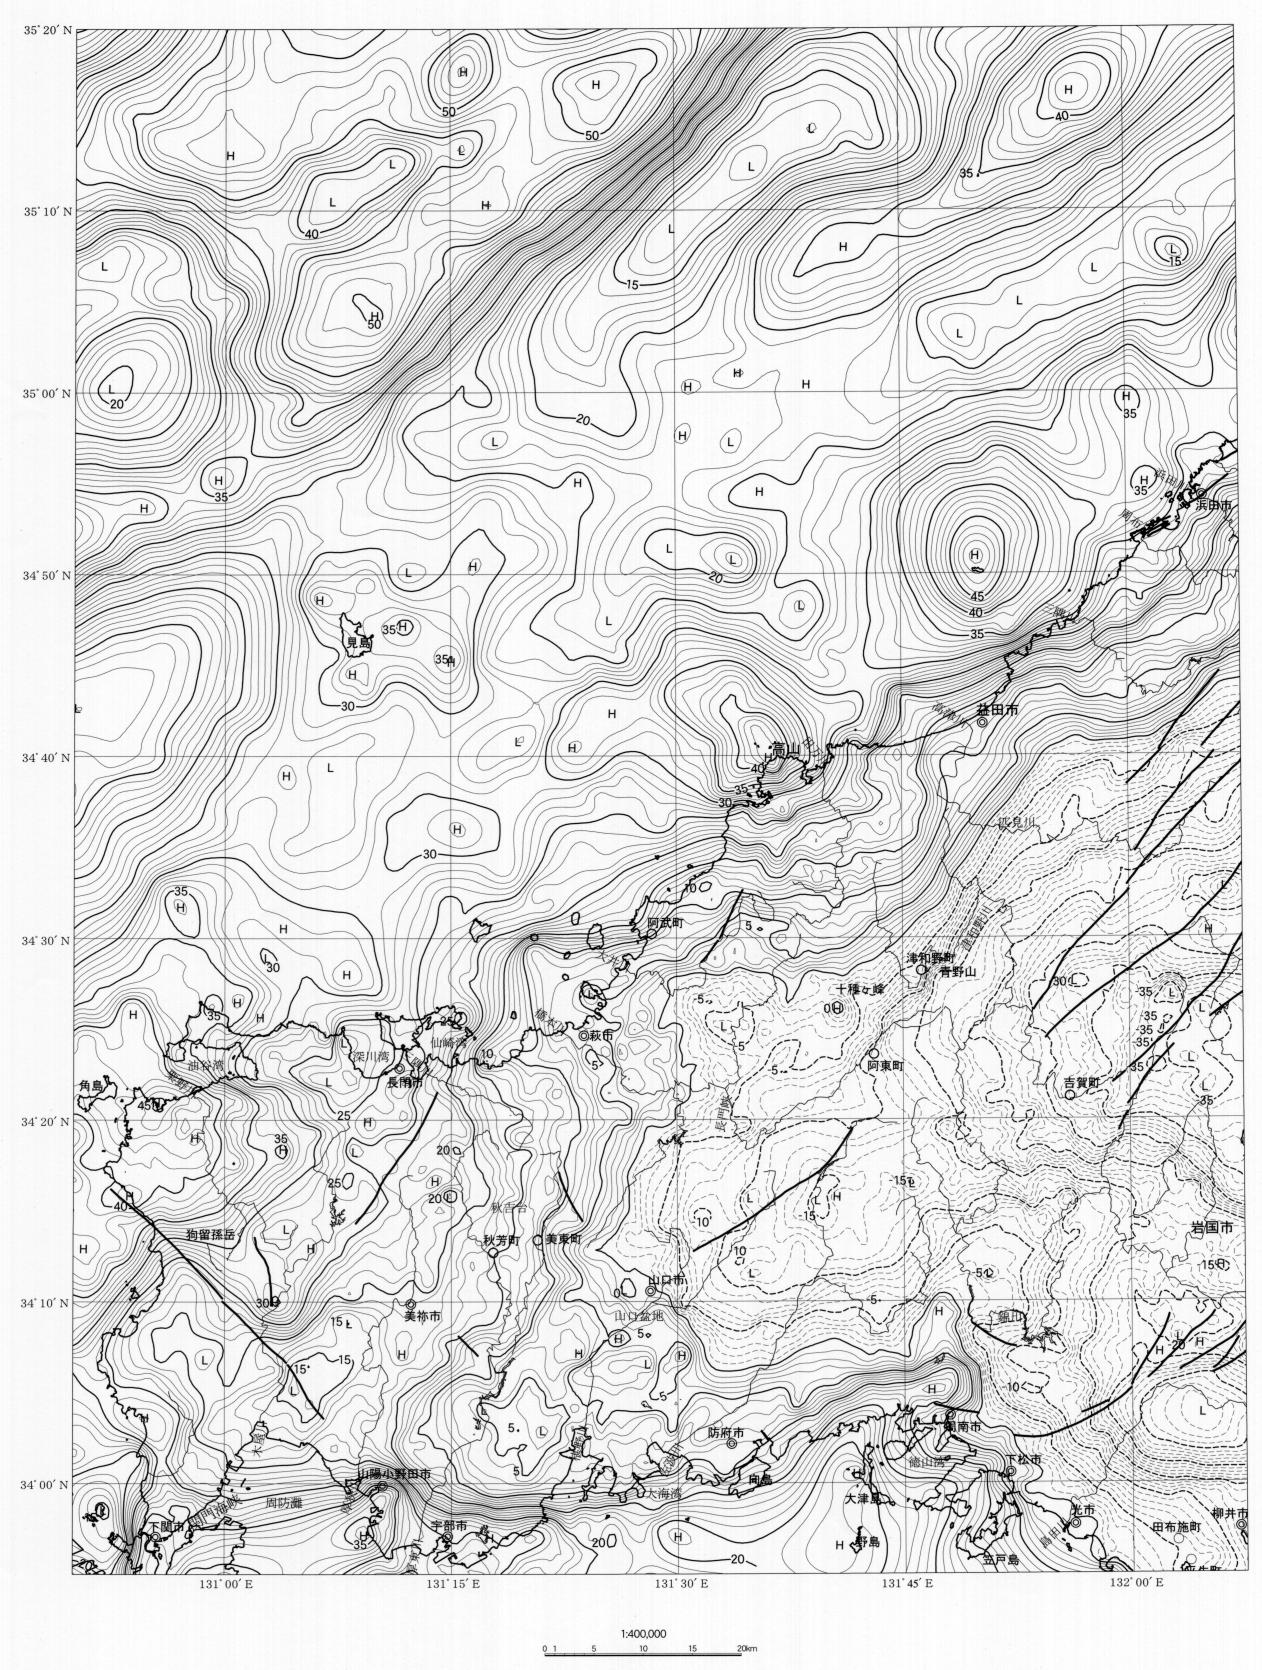
The density for both Bouguer and terrain corrections is taken to be 2.3g/cm3. We show gravity maps assumed densities were 2.0g/cm3 (Fig.1) and 2.67g/cm3 (Fig.2), respectively.
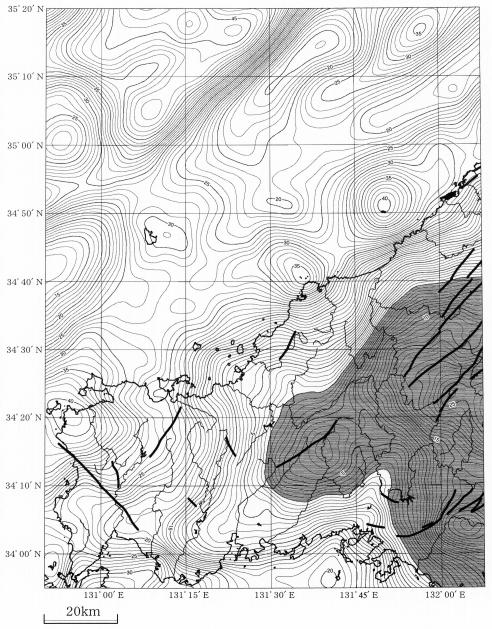
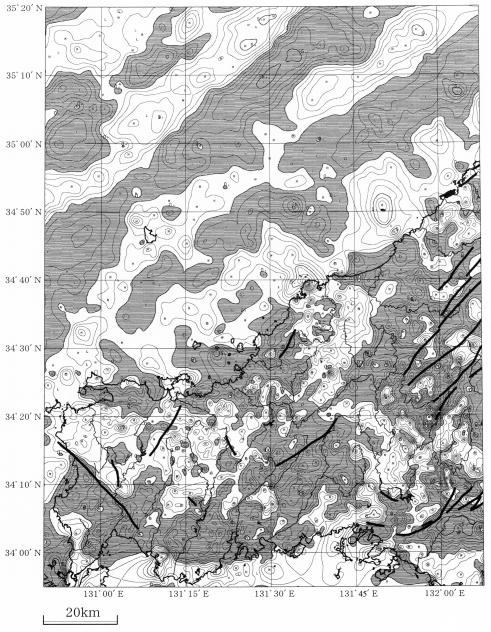
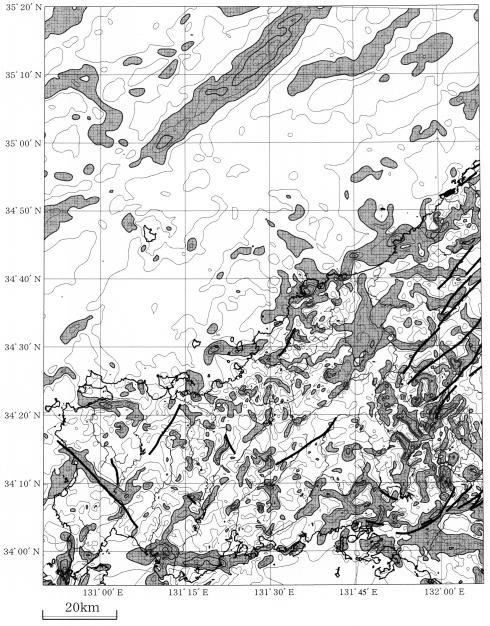
Regional Bouguer anomalies (Fig.3), a residual Bouguer anomalies with the removal of the 2km upward-continuation (Fig.4) and horizontal derivation (Fig.5) maps were shown in this side.
The Bouguer anomalies caused by local geological feature are clearer on the residual map. The horizontal derivation map clearly shows structural boundaries like active faults.