| No. | Data | Chart | Characteristics | |
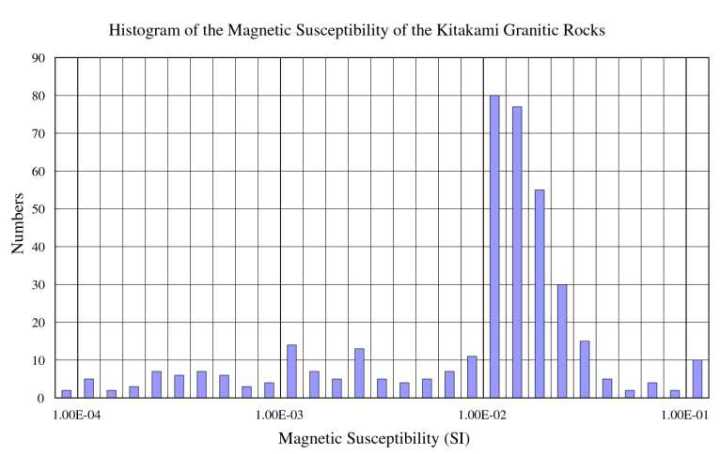
| 1 | Magnetic susceptibility |
|
The magnetic susceptibility ranges roughly from 10-4 to 10-1 (SI) but many of them fall within the range of 10-2 to 10-1 (SI).
Average: 2.56 x 10⁻² (SI)
Std. Dev: 2.84 x 10⁻⁴ (SI) | |
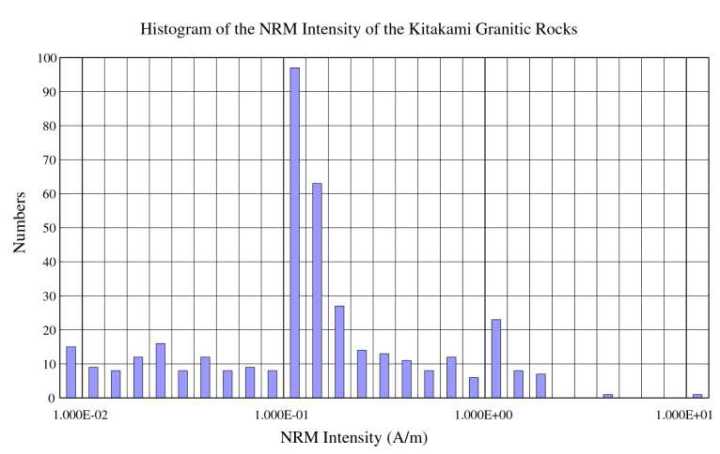
| 2 | Intensity of NRM |
|
The intensity of NRM ranges roughly from 10-2 to 100 (A/m) but many of them fall in the order of 10-1 (A/m).
Average: 0.47 (A/m)
Std. Dev: 1.02 (A/m) |
|
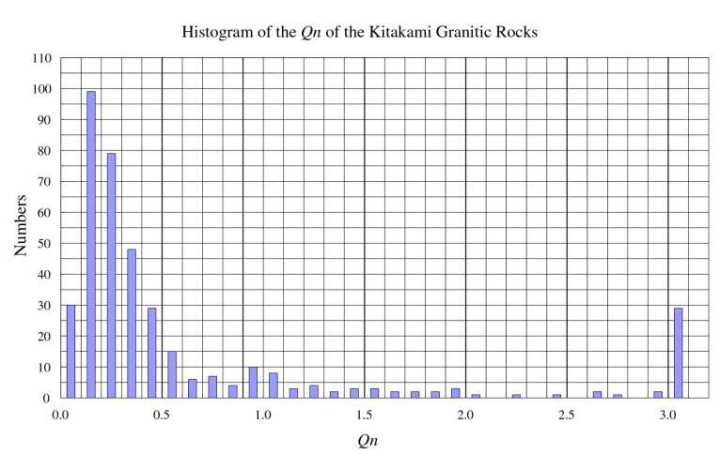
| 3 | Qn ratio |
|
Consequently, the Qn ratio is roughly less than 0.5. This means we can neglect the effect of the remanent magnetization to interpret magnetic anomalies caused by the Kitakami granitic rocks. | |
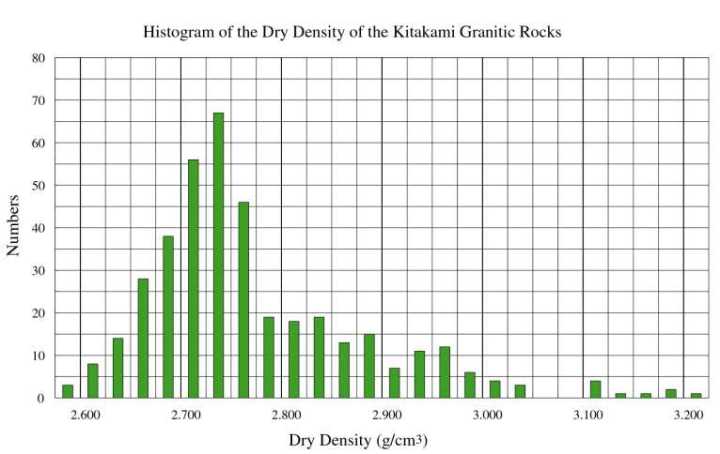
| 4 | Dry density |
|
The dry density ranges from 2.60 to 3.00 (103kg/m3). Most of them fall within the range of 2.65 to 2.75 (103kg/m3) but many of them exceed 2.80 (103kg/m3). Average: 2.77 (103kg/m3) Std. Dev.: 0.11 (103kg/m3) |
|
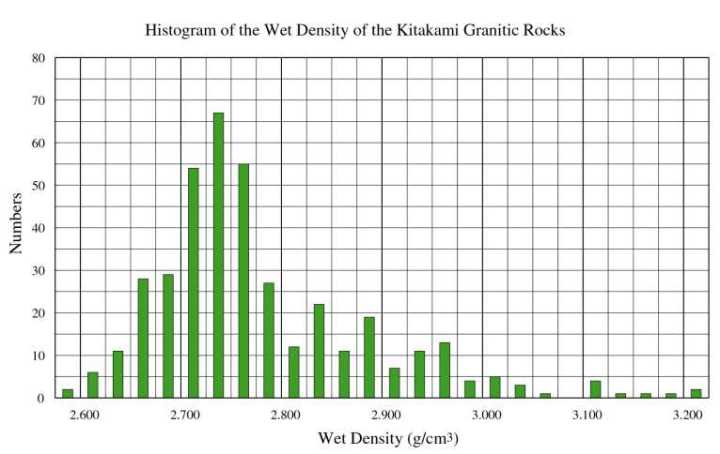
| 5 | Wet density |
|
The wet density also ranges from 2.60 to 3.00 (103kg/m3). Most of them fall within the range of 2.65 to 2.80 (103kg/m3) but many of them exceed 2.80 (103kg/m3). Average: 2.78 (103kg/m3) Std. Dev.: 0.11 (103kg/m3) |
|
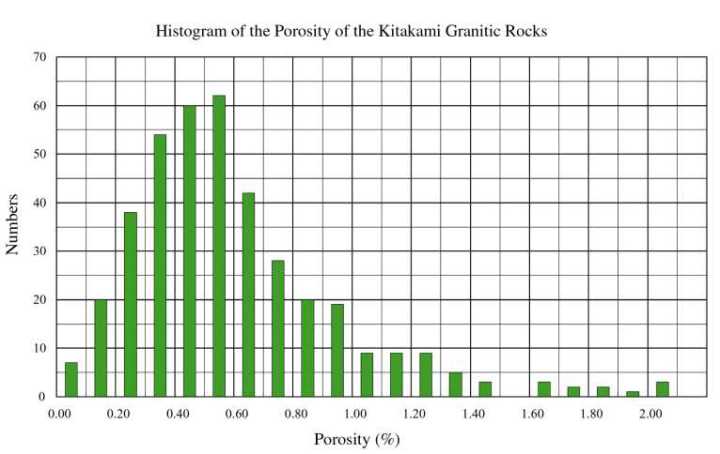
| 6 | Porosity |
|
Cosequently, the porosity is no more than 1.0 (% ). Average: 0.61 (%) Std. Dev.: 0.37 (%) |
|
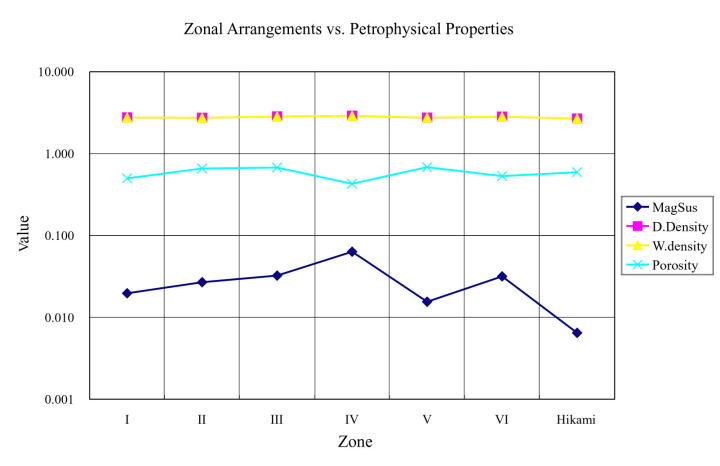
| 7 | Variation among zones |
|
Petrophysical data vary in some amounts among each zones. Generally, the more magnetic, the denser the specimens are. Granitic blocks, which belong to Zone IV and VI, are more magnetic and denser than the others, suggesting to a quantitative difference of mafic minerals. |